
Solar Scattered, Coal Still Standing
What an Indiana tornado revealed about the cost of fragile power


A quick note: On Tuesday, March 10th, an EF1 tornado touched down in Northwestern Indiana and Northeastern Illinois. Police and fire officials say that at least 10 to 15 homes have severe damage, and an elderly couple was tragically killed in the storm. We encourage anyone who is interested in helping to donate to the Indiana charity of their choice.

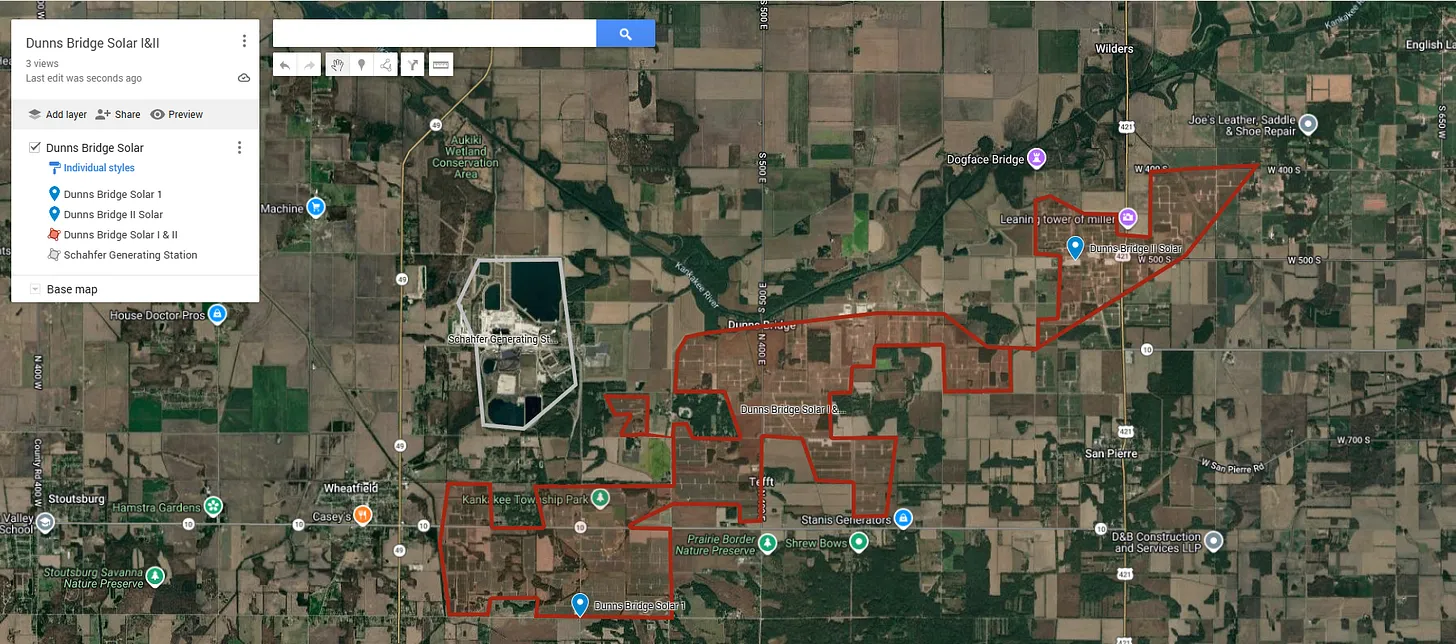
On Tuesday, March 10th, an EF-1 tornado destroyed the Dunns Bridge Solar I and II facilities owned by the Northern Indiana Public Service Company (NIPSCO). The facilities, located outside of Wheatfield, Indiana, had 2.4 million solar panels, totaling 700 megawatts (MW) of power capacity, and reportedly cost $1 billion to construct—a little over $1,400 per kilowatt (kW).
NIPSCO issued the following statement in the aftermath:
On the evening of March 10, while actively monitoring severe weather and responding to storm‑related outages across our service area, NIPSCO became aware of damage to its Dunns Bridge I and Dunns Bridge II solar facilities in Starke and Jasper counties. Our team was tracking the storm in real time and moved in to assess conditions and respond as soon as it was safe to do so. Debris from the damage could have been displaced, and we are working to safely secure the area, assess the damage and proactively communicate with the community.
We recognize there may be questions and concerns about potential environmental impacts related to the damage at the solar farm. Solar panel leaching concerns have been thoroughly evaluated in industry-leading research, which shows that the risk is extremely low. Overall, the available evidence demonstrates that both crystalline silicon and thin-film PV (i.e., photovoltaic) modules do not pose a meaningful risk of environmental or human exposure from leaching, even when damaged.
The Chief Deputy of Jasper County Sheriff’s Department, Brandon Napier, noted, “Just the path of the tornado that came through, we have several large solar fields to the east of the town here it went right through the solar field and just ripped a lot of them out.”
While the solar panels were damaged by the tornado, we are not aware of any reports of damage at the nearby R.M. Schahfer Generating Station, a 950 MW coal facility that NIPSCO was planning to retire at the end of 2025. However, it is still running thanks to a 202(C) order issued by the U.S. Department of Energy requiring the plant to continue operations. Click on the map below to explore the custom Google Map we made this week of the facilities.
This week, we wanted to take the opportunity to explore more about NIPSCO and share some data with our readers, especially given our recent research in the state.
This article will explore the cost of the destroyed solar facility compared to the nearby R.M. Schahfer Plant, and explore how energy costs have changed in the NIPSCO service territory in response to changes in the company’s generation fleet, using some cool data from S&P Global.
It’s kind of a meandering exploration, but one of the things we value most about Substack and our readers is our ability to explore new ideas and see the feedback you all give. Thanks for being part of it.
Implications of the Destruction
According to S&P Global, the Dunns Bridge solar projects were built to “support Northern Indiana Public Service’s goal of becoming coal-free by 2028, reducing carbon emissions by more than 90 percent by 2030, compared to a 2005 baseline, according to the utility.”
The situation begs several questions:
If climate change is going to make the weather more extreme, how does it make any sense to shut down coal plants and build energy generation facilities, like solar, that are destroyed by extreme weather?
Are the company’s coal-free and emissions reduction goals increasing the company’s exposure to costs associated with weather events, and why should ratepayers be saddled with these additional costs?
Was there any damage to the R.M. Schahfer coal plant or the onsite battery storage facility at Dunns Bridge?
What type of insurance policy is in place for the solar facility, and what deductible would the company be required to pay, if any?
What liability, if any, does the company have for the cleanup of the site and surrounding areas?
How is any of this in the best interests of ratepayers?
We reached out to NIPSCO via their “24-hour” media hotline, asking for this information, but they did not respond to our inquiry at the time of publication, and we sincerely doubt they will.
However, these are questions the company should have to answer in front of the Indiana Utility Regulatory Commission on March 24th at its scheduled hearing on energy affordability. They can dodge our questions, but they had better come clean to the regulators.
The Cost of Tornado-Truncated Solar Facility
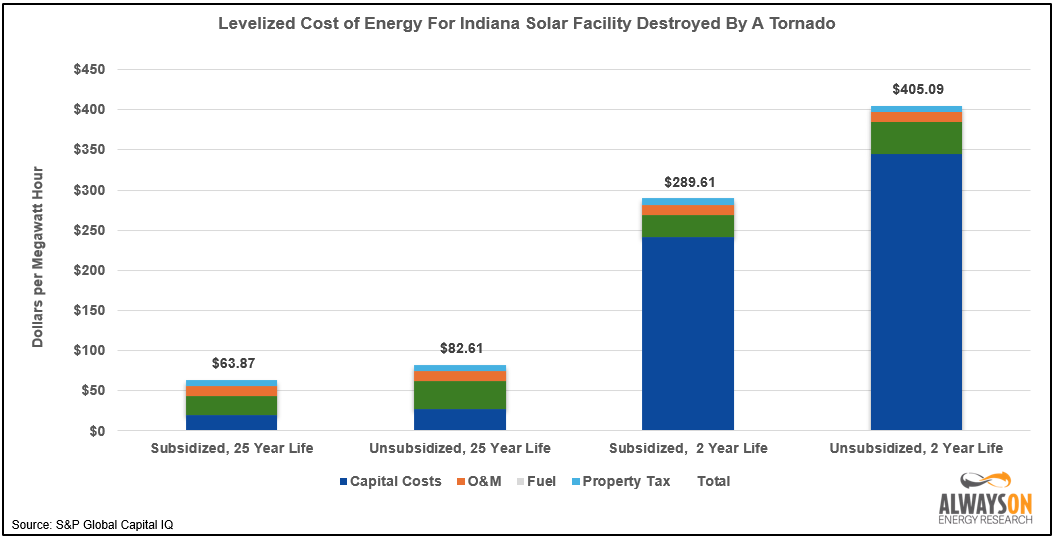
Let’s be incredibly uncharitable and look at the anticipated levelized cost of energy (LCOE) of the solar facility over its projected 25-year useful lifetime, and its actual, tornado-truncated lifetime.
Dunns Bridge I began generating power in June of 2023, producing a total of 1.3 million megawatt hours (MWh) up until December of 2025, the most recent month for which data are available. Dunns Bridge II began generating power in January of 2025, and through December, it produced 812,439 MW of power, which is good for a 21.3 percent capacity factor.
We calculated the LCOE over two time periods: a 25-year lifecycle, a standard assumption in the industry, and a 2-year lifecycle to account for the facility being destroyed very early in its lifecycle. The results are about what we would expect. Our estimated subsidized costs over 25 years are approximately equal to S&P Global’s reported PPA cost for the facilities, including subsidies.
Because the LCOE is like calculating the cost of driving your car over the number of miles driven, if your car dies after two years when you expected to drive it for 10, the cost per mile obviously increases. This is why the cost of electricity from the Dunns Bridge I & II facilities skyrockets in this analysis, reaching a subsidized cost of $289.61 per MWh, and an unsubsidized cost of $405.09 per MWh.
Is this a fair comparison? Probably not, because the solar facility was almost certainly insured and will likely be rebuilt after the site is remediated. The question is: how much are the cleanup and replacement costs, and what is the insurance deductible for the damaged facility, and who has to pay them?

It’s one thing to have an old roof on your house destroyed by a hailstorm (score), because you get a new roof for a fraction of the true replacement cost. But it’s another thing entirely to have a brand-new roof destroyed, because then you have the privilege of paying the deductible just to get your new roof back.
That’s potentially where NIPSCO’s ratepayers could end up sitting.
The Cost of the Nearby Coal Plant
In our upcoming LCOE study for Reliable Energy Inc. in Indiana, we found that the R.M. Schahfer plant was the most expensive coal plant in the state, due primarily to very high delivered fuel costs at the plant ($50 per MWh).
However, the December 2025 data from S&P Global, the most recent available, show the delivered fuel cost was about $27 per MWh, which substantially improves the economics of the plant, although this could possibly be the result of the company assuming the plant would retire at the end of the year, rather than being required to stay open.
At $70 per MWh, the Schahfer plant is competitive with subsidized solar over a 25-year lifespan, cheaper than the unsubsidized cost over 25 years, and a bargain compared with our admittedly uncharitable comparison to the facility’s actual 2-year lifespan.
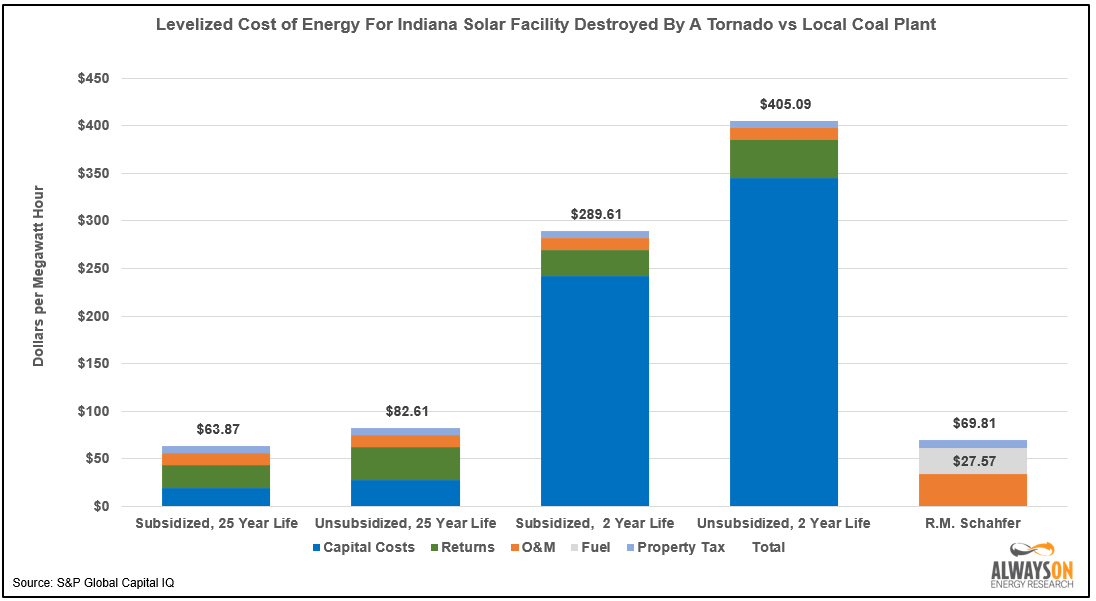
Of course, this analysis does not even account for backup power or other hidden costs associated with accommodating the solar facilities. If we did, the Schahfer plant would be the clear winner, even when compared to the subsidized cost of solar panels.
NIPSCO’s Changing Generation Profile
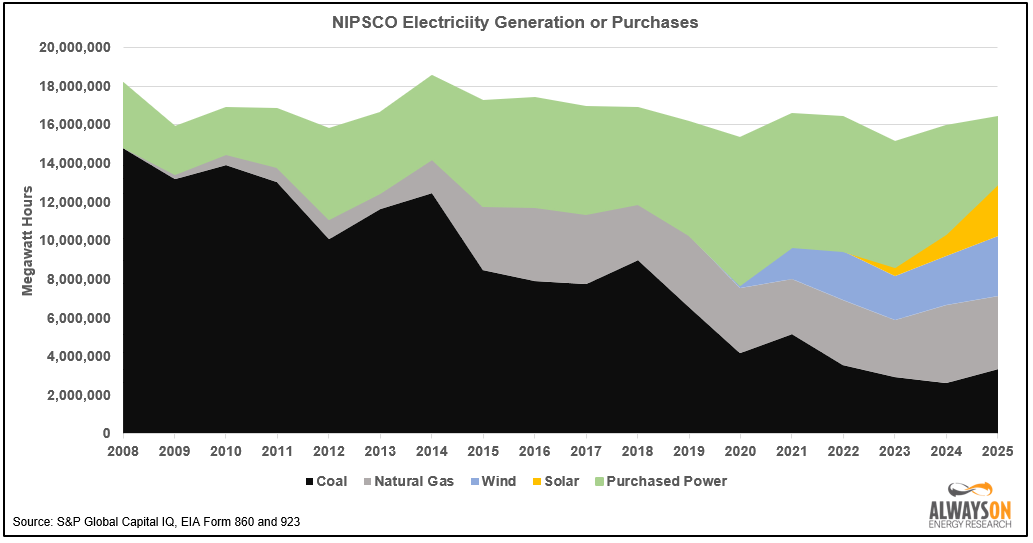
NIPSCO’s Dunns Bridge solar facilities are part of a larger trend away from coal-fired power generation toward natural gas, MISO market purchases, and increasingly, wind and solar ownership or power purchase agreements (PPAs).
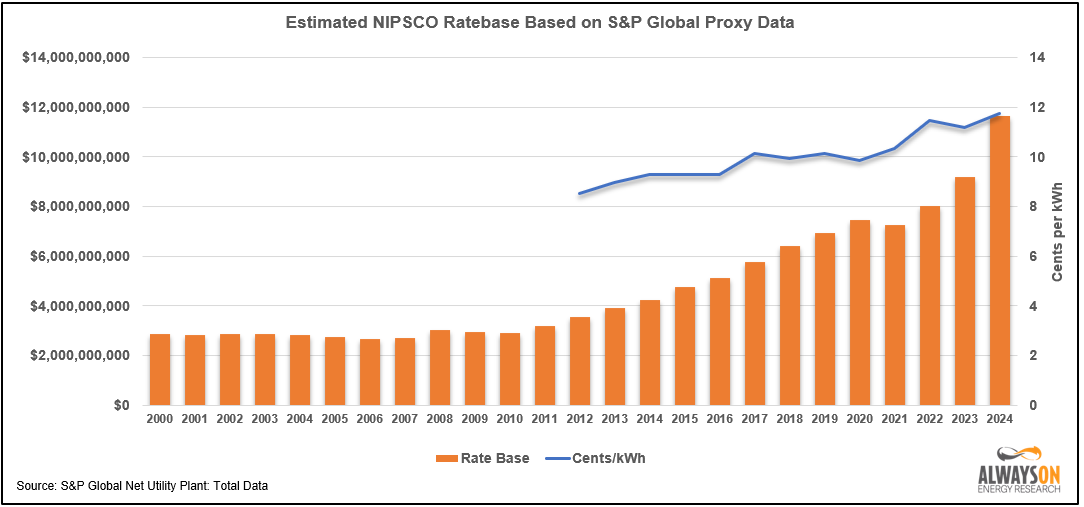
This trend has coincided with a massive increase in the utilities’ estimated rate base. Data from S&P Global show NIPSCO’s rate base has more than doubled since 2016. You’ll notice that the rate base was essentially flat from 2000 to 2010 in non-inflation-adjusted terms. This is because electric companies are supposed to see their rate bases stabilize as their assets depreciate over time.
The upward trend in rate base growth led to higher rates. Unfortunately, we are still compiling our database of historical utility rates, so we only have data going back to 2012. During this period, NIPSCO’s All-Sectors electricity rates increased by 38 percent.
It’s also interesting to look at what’s causing the rate base growth. In the mid 2000s and 2010s, the growth in NIPSCO’s spending was driven by generation spending. However, transmission and distribution spending began to increase around 2018, and generation spending fell in 2021, but rebounded slightly in 2024.
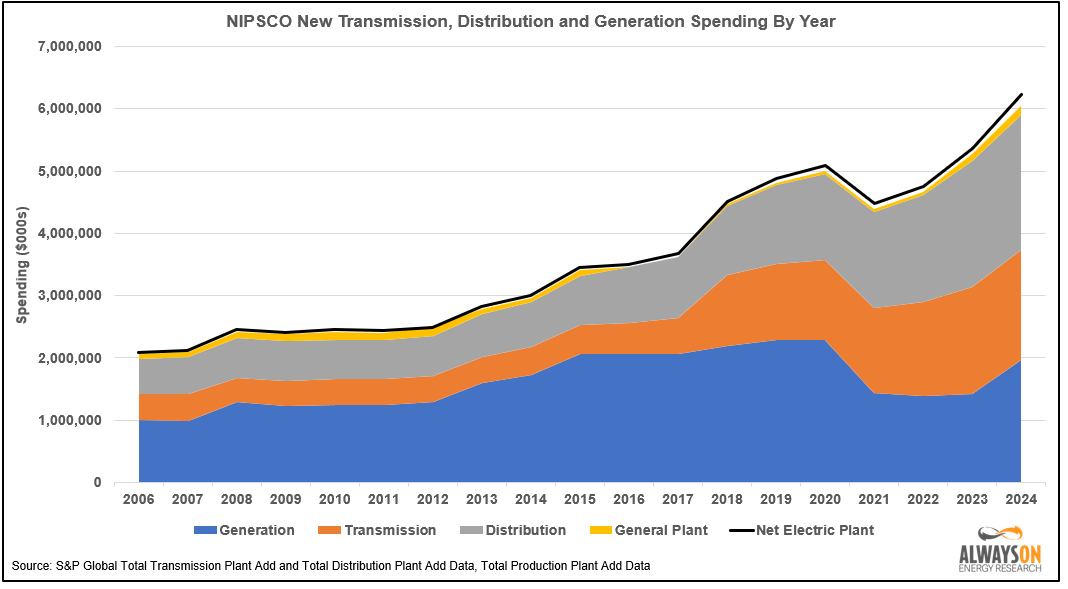
This graph supports some of the claims made in the Lawrence Berkeley National Laboratory (LBNL) study, which suggested that transmission and distribution, not generation, charges have increased electricity prices since 2020. However, it’s also worth noting that the graph above suggests the LBNL study may be missing significant increases in generation costs that occurred prior to 2020.
A Note On Cleanup and Contamination Concerns, Our Two Cents
Photos of the broken panels have stoked fears on social media about potential environmental damage from toxic chemicals leaching out of the shattered panels into the soil and local groundwater supplies.
For our part, we would encourage those in the surrounding areas not to worry too much about chemicals leaching from the panels into the soil or water. Photovoltaic panels are made mostly of glass, and the small amounts of toxic materials, such as lead used in soldering, are not a significant concern because they are present in small quantities and there is probably no realistic exposure pathway for humans.
In this regard, it’s important to remember that it’s the dose that makes the poison. Taking too much Tylenol will kill you; a small amount will not.
While we are not overly worried about chemicals leaching from the panels, we are concerned about the glass. Glass is not generally considered toxic, but broken glass scattered across neighboring properties is still a problem. The storm likely blew debris well beyond the solar site, which could create issues for nearby farmers, especially if they are growing root crops.
Anecdotally, we’ve heard that large potato buyers won’t purchase potatoes from growers located within a mile of a glass recycling facility for precisely this reason. In other words, the real concern here isn’t chemical contamination, it’s debris.
NIPSCO should absolutely be on the hook for the cost of cleaning up the mess their solar panels created, but we also want to give people nearby some peace of mind that it’s not likely that this incident is posing a risk to their health.
Conclusion
There are lots of things that break when they get hit by a tornado, but our power plants shouldn’t be one of them.
The demise of the Dunns Bridge I & II solar facilities by one of the weakest classifications of tornado should be a nudge to Indiana policymakers and utility regulators that shutting down dispatchable thermal plants in favor of flimsier wind and solar facilities is not a prudent course of action.
Frankly, the Trump administration should be lambasting companies like NIPSCO for continuing to pursue their voluntary decarbonization pledges when electricity bills are rising, and demand is soaring due to data centers. A few mean tweets might go a long way toward helping utility executives and their Wall Street investors understand they can no longer Green Plate the grid at the expense of everyday Americans.
Please Like, Subscribe, and Share, or we will detail your financials next week!

NERC’s 2019 Long-Term Reliability Assessment. Can you believe they didn’t even have the map of doom back then? Also, only Texas was thought to have insufficient power then. Simpler times.
A Method to estimate the economy-wide consequences of widespread, long duration electric power interruptions. We’re looking into how the national labs model the cost of blackouts based in duration, customer class, and how widespread the outages are.