Stealing with Solar: The Great Net-Metering Heist
How Solar Panels Helped Wealthy Californians Pick The Pockets of Low-Income Families
Have you ever wanted to steal from the less fortunate without going to jail? Have we got a deal for you!
Affluent households in California siphoned nearly $3.4 billion in 2021 from the pockets of low-income families through a government program called net metering. This program allows people with solar panels to get free electricity while forcing people who can’t afford them to pay all of the costs associated with maintaining the electric grid. What a steal!
How Net Metering (Usually) Works
Net metering allows customers with rooftop solar installations to sell their electricity back to the grid at the full retail price of power rather than the lower wholesale price that other power providers are paid. This is great if you own solar panels, but it effectively pays rooftop solar owners more than the electricity is worth.
For example, U.S. Energy Information Administration data show the statewide average retail residential electricity rate in California was 25.84 cents per kilowatt hour (kWh) in 2022. This means someone with solar panels on their house would be paid the full retail cost of 25.84 cents per kWh.
The problem with this arrangement, however, is that the people with solar panels on their roofs are not paying their fair share to upkeep the rest of the grid, but these substantial costs don’t disappear; they are foisted upon people without solar panels.
For example, while using solar power will reduce the need to burn some fuel, the cost of fuel is a relatively small part of the total retail price of electricity. Figure 1 below shows the cost of natural gas for a combustion turbine peaking plant—the most expensive type of natural gas plant—was 9.77 cents per kWh in 2022, or about 38 percent of the full retail cost of power.*
*Note: The fuel costs for combustion turbine gas plants are much higher than nuclear fuel, which is generally 0.61 cents per kWh, and natural gas combined cycle, which was 6.4 cents per kWh based on 2022 EIA data. This analysis is, therefore, very conservative, and the cost shift from solar owners to non-solar owners is even larger.

The remaining 62 percent of the retail cost of electricity goes towards a myriad of things required for the maintenance and operation of the grid: maintaining the natural gas and other power plants in California that *sometimes* keep the lights on, paying employees of the electric company, building and maintaining transmission lines, and upkeep for the distribution system.
By getting paid the full retail price of 25.84 cents per kWh, instead of the 9.77 cents of avoided fuel costs, people with solar panels are not paying to maintain the rest of the electric grid. However, these costs—16.07 cents per kWh—do not cease to exist, especially in a state where electricity bills are soaring as a result of utility companies spending billions on wildfire prevention; they are simply passed on to customers who do not have solar panels, which is why the houses without solar panels in Figure 1 look so sad.
The California Public Advocates Office put it this way in a filing:
Public Advocates Office asserts the [net metering] study “clearly shows the [net energy metering] NEM 1.0 and NEM 2.0 tariffs create equity concerns due to the misalignment between costs and value,” which then “creates revenue under-collections that must be recovered by nonparticipating customers.” Public Advocates Office observes that the Lookback Study shows the NEM 2.0 tariff unreasonably burdens non-participants of net energy metering. Public Advocates Office estimates the annual cost burden generated by the NEM 1.0 and 2.0 tariffs will be approximately $3.37 billion in 2021.
Joint Utilities also support this finding, asserting the Lookback Study concludes that NEM 2.0 participating customers receive “significant financial benefits” at the “expense of non-participating customers.”
In short, the folks with solar panels are effectively picking the pockets of families without them.
A Wealth Transfer to the Wealthy
This arrangement is unfair for two main reasons.
For one, people with panels are generally wealthier than people who don’t have them. Two, people with solar panels are more reliant upon the grid than anyone else because they effectively use the grid twice. They use it once to buy power when the sun isn’t shining—as in, every night when the sun sets and during winter months—and again to sell extra power back to the grid when their panels are actually producing.
Solar panels are a large up-front investment, frequently costing between $10,000 and $20,000 even after lucrative federal subsidies, such as the Investment Tax Credit (ITC), are accounted for. The high cost of these systems creates a substantial barrier to entry for low- and medium-income households who might want to install them on the roofs of their homes.
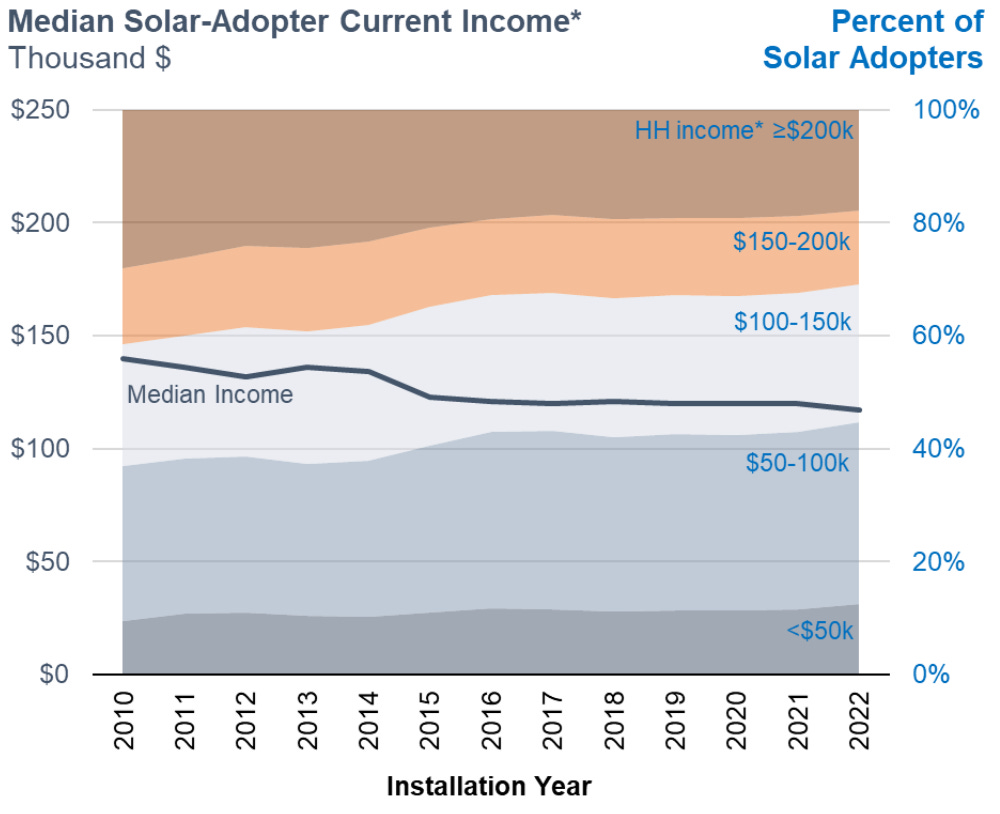
Figure 2, provided by the Lawrence Berkeley National Laboratory, shows that 62 percent of solar adopters since 2010 have been high-income households making more than $100,000 per year. Only 10.4 percent of solar adopters had household incomes below $50,000 in 2022.
The data are more alarming when we look at the percentage of households with solar by income bracket.
Data from the U.S. Census Bureau and Berkeley Labs show only 0.67 percent of California households making less than $50,000 had solar systems on their homes in 2022 (See Figure 3.) In contrast, 2.63 percent of households making between $150,000-$200,000 had solar, meaning affluent households were nearly four times more likely to have solar than the poorest Californians.
We also see an interesting geographical pattern in solar adoption. Residential solar systems tend to be concentrated in some of the wealthiest zip codes in California, such as those located in Los Angeles, San Diego, and San Francisco, as the map in Figure 4 shows.

The regressive nature of net metering finally became so obvious that the California Public Utilities Commission put forth controversial plans to adjust the reimbursement rates of the program.
California PUC Reforms Net-Metering
The California PUC couldn’t ignore the ongoing massive wealth transfer from low-income to high-income earners in the state forever.
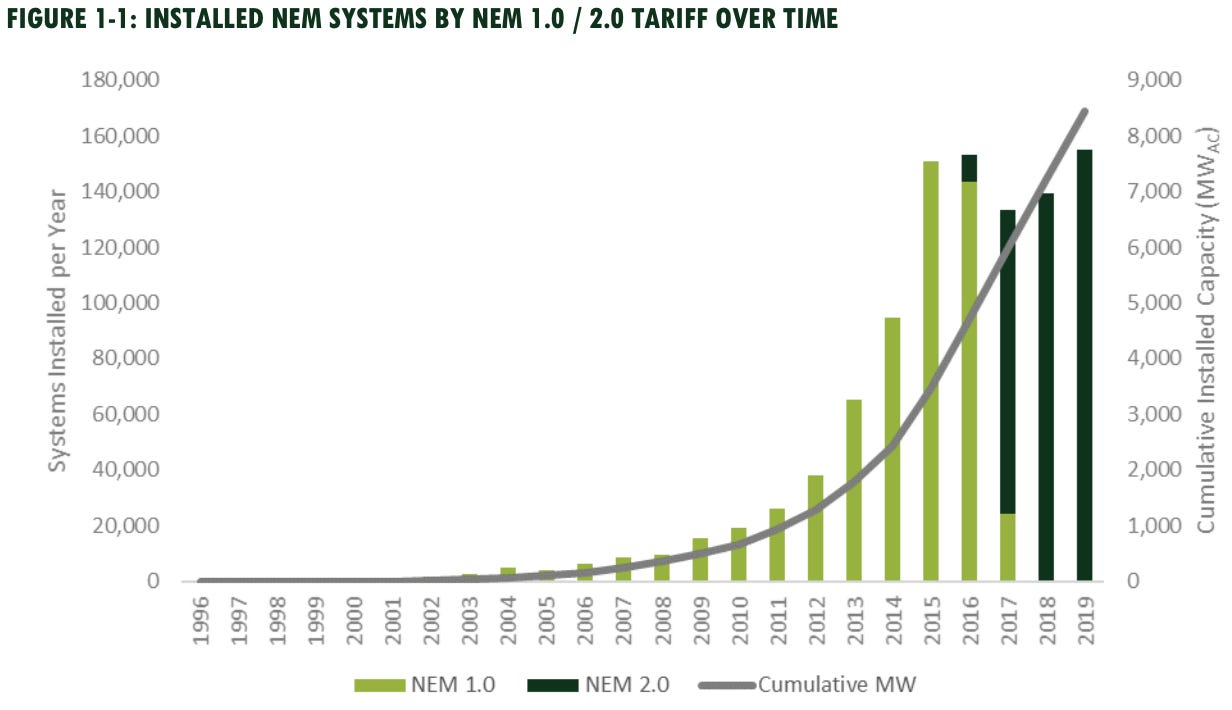
The first reform was the NEM 2.0 program—which did very little to address the main issue of overpaying for solar generation because it maintained the basic net metering principle of paying the full retail price. However, it still led to a slight reduction in annual installations in the state, which you can see in Figure 5.

The major change to net metering happened in December 2022, when PUC commissioners passed an updated NEM 3.0 program that became effective in April 2023. This program was based on net billing as opposed to net metering. EnergySage explains the difference:
In NEM 3.0, the CPUC established a new rate for crediting solar exports, shifting the structure from net metering to net billing, which is much lower in value – and by lower, we mean…lower. NEM 3.0 is based on "avoided cost" rates, meaning what your utility pays for any electricity you send to the grid is no longer based on your typical electricity rates, like a traditional net metering credit, but rather calculated separately. The exact rate varies depending on the hour of the day, day of the week (i.e., weekday vs. weekend), and month you export the energy: in fact, there are 576 possible export rates in total! On average, the avoided energy costs rates come out to about 25 percent of retail electricity rates during those same hours, meaning the value of net metering credits has decreased by about 75 percent under NEM 3.0.
This substantial change in compensation dealt a pretty serious blow to Califorania’s solar industry and has incentivized more households with solar to also buy batteries for on-site storage.
Rooftop Solar Slows Without the Wealth Transfer
Data reported by CalMatters suggests that the rooftop solar industry owes much of its existence to the previous net metering policies.
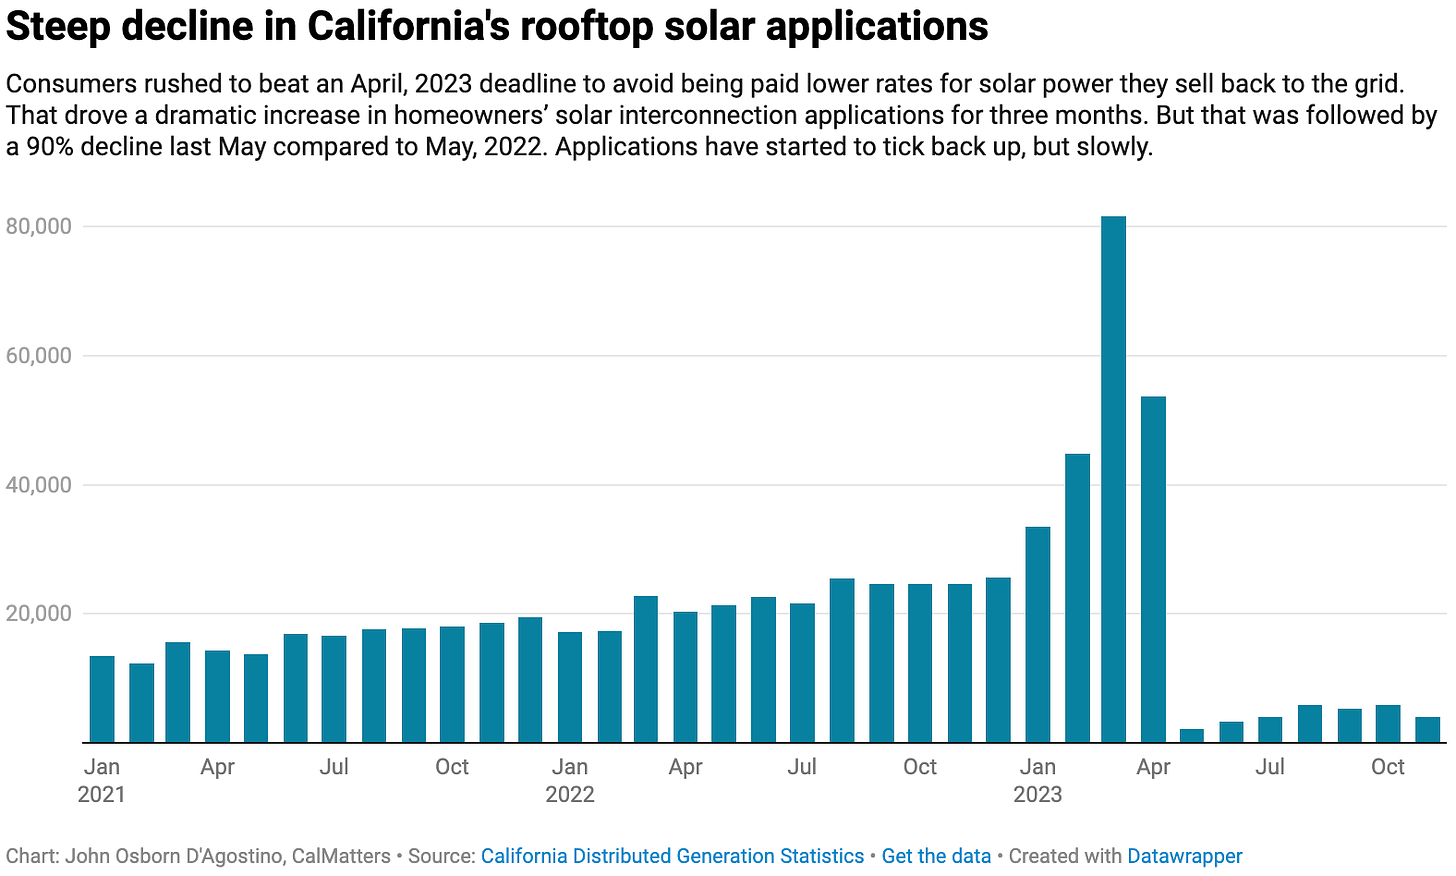
Installations soared from January to April 15th of 2023 as Californians rushed to lock in the more lucrative reimbursement rates for 20 years before the deadline passed. After the new reimbursement rates went into effect, rooftop solar installations fell by 80 percent, which you can see in Figure 5.
This drop in installations has, unfortunately, led solar installers to cut as many as 17,000 jobs, representing 22 percent of total employment in the solar industry. While these workers have our sympathies, changing the reimbursement rates was the right thing to do.
The dramatic drop in California’s solar market serves as a good reminder of what can happen when an industry is propped up almost entirely on government subsidies; when the subsidies stop, the industry generally fails in the free(ish) market.
Not Just A California Problem
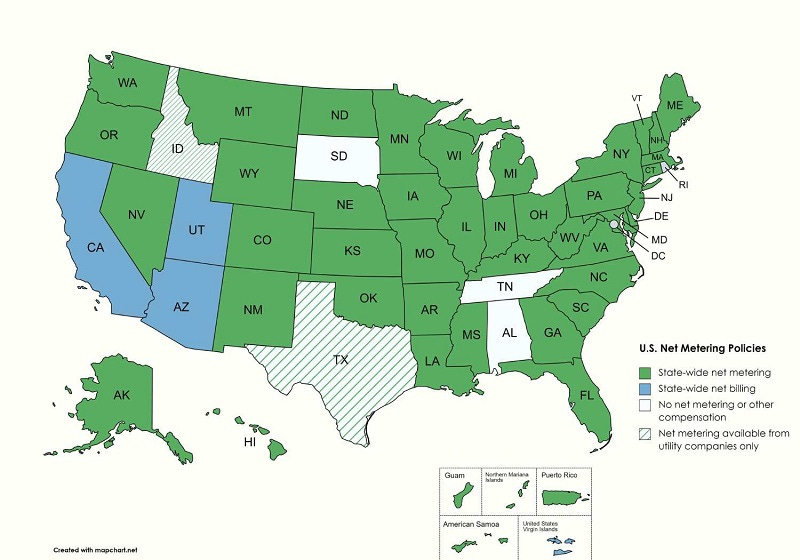
California’s net metering program became so massive that it was no longer sustainable, but Figure 6 from YellowLite shows the vast majority of states throughout the country have not yet hit that critical mass, so net metering remains in some capacity. This means costs are still being shifted from the predominantly affluent people who purchase solar panels to the less fortunate.

What’s the right solution when it comes to paying people with solar panels for the power they produce?
The answer lies in paying them only the avoided fuel cost—or something along the lines of the net billing changes implemented by California—but policymakers likely won’t change the generous reimbursement rates until we shame them into doing it.
If you’re considering getting solar panels to save money on your power bills, we understand that desire. Just remember that there is no such thing as a free lunch—and it’s important to think about who will ultimately be footing the bill.
Click Like, Subscribe, and Share!
Enjoy reading? Want more? Here are a few of our favorite posts of the week from some other amazing writers on Substack:


