Wind and Solar up to 12 TIMES More Expensive Than Natural Gas in New England
The TRUE cost of wind and solar in New England is revealed
The true cost of wind and solar energy in New England is not competitive with that of natural gas. This is especially true for offshore wind, which, according to our modeling, will be twelve times more expensive than combined cycle (CC) natural gas in the region.
In our last post, we discussed our recent report, “The Staggering Costs of New England’s Green Energy Policies.” As a reminder, or for those who haven’t read it, New England would need to pony up an additional $815 billion through 2050 to achieve net-zero and electrification. This would lead to skyrocketing electricity prices for families and businesses in New England, who already pay some of the highest rates in the country.
This week we’re going to show how the all-in cost of wind and solar energy in New England will be anywhere from six to twelve times more expensive in 2050 than the cost of existing natural gas when accounting for the cost of maintaining reliability.
The all-in cost of wind and solar provides a more apples-to-apples comparison between the cost of thermal and weather-based generators than metrics like the Levelized Cost of Energy (LCOE).
Below, we explain the figures from our report and why they differ from LCOEs.
The All-In Cost of Wind and Solar in New England
New England relies mostly on natural gas for its energy needs. In order to transition to net zero, therefore, wind and solar will have to replace most of the natural gas generation on the ISO-NE grid.
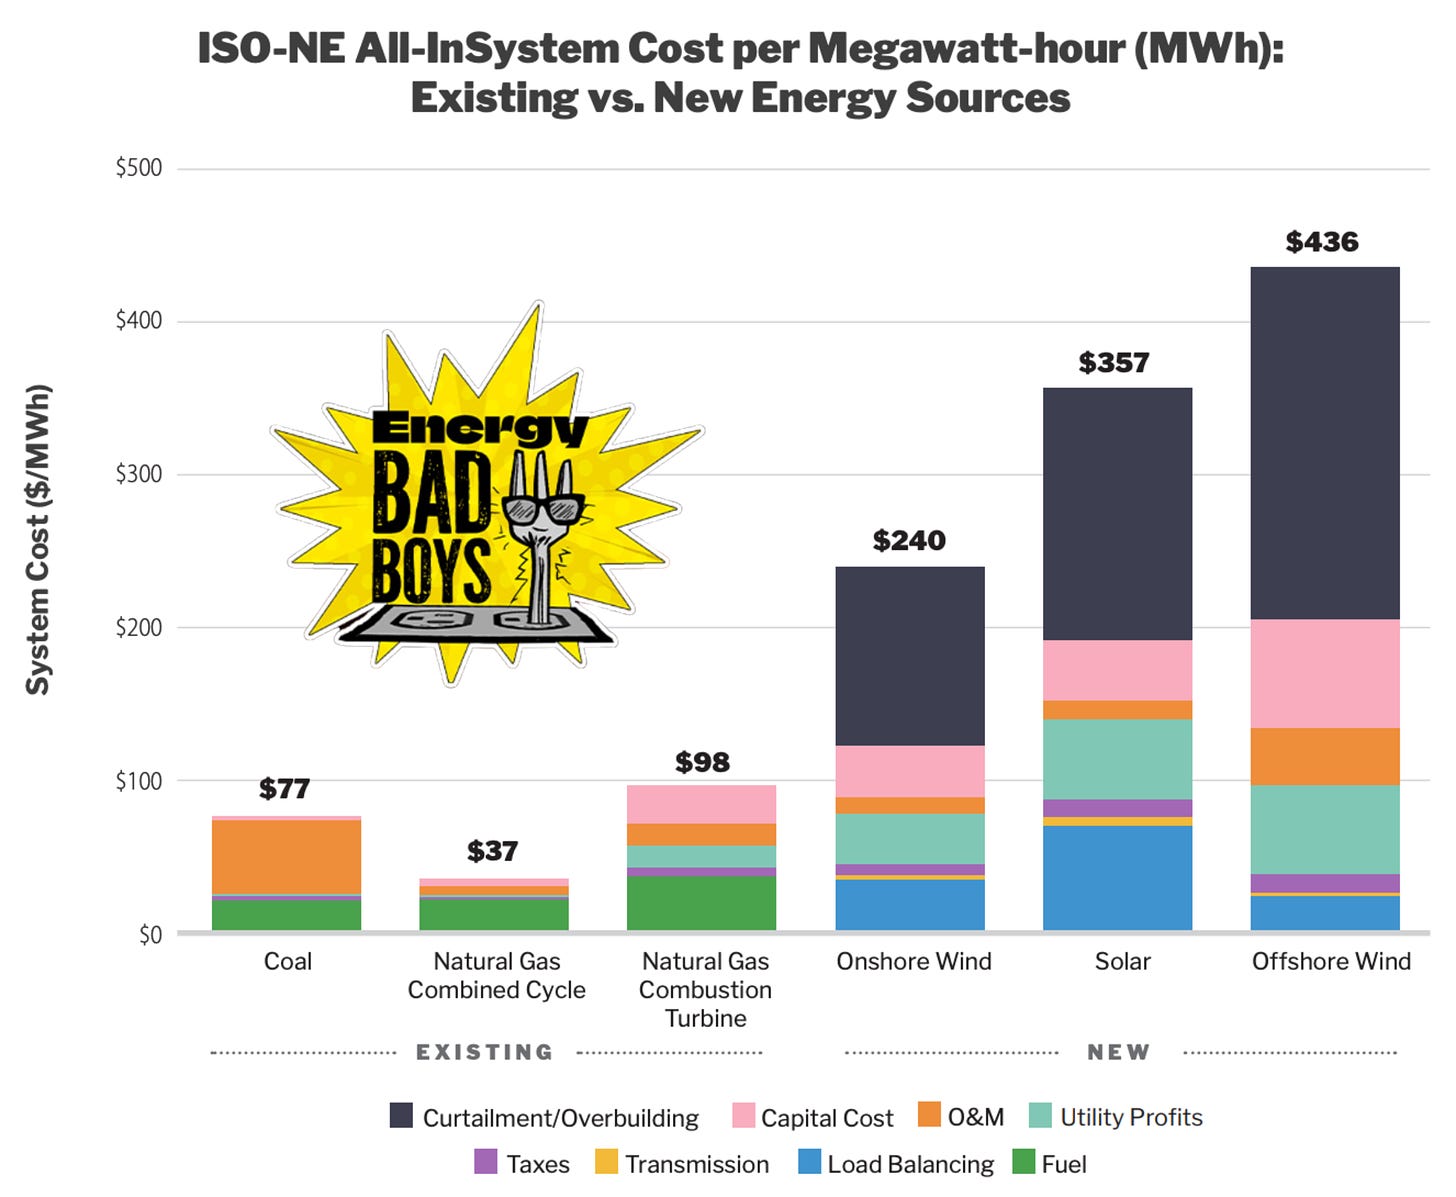
Existing combined cycle (CC) natural gas facilities produce power at $37 per megawatt-hour (MWh), followed by coal at $77 per MWh, and combustion turbine (CT) gas at $98 per MWh. These values are based on capacity factors of 42 percent for natural gas CC plants, 7 percent for coal, and 15 percent for natural gas CT.
Based on our modeling, the all-in cost of onshore wind, solar, and offshore wind in the New England region is $240 per MWh, $357 per MWh, and $436 per MWh, respectively, as the graph below shows.
As you can see, the all-in costs of wind and solar will dwarf the cost of existing natural gas—even peaker plants.
The highest hidden cost associated with wind and solar is the cost of overbuilding and curtailing generation, which stems from the intermittency of wind and solar, or the variable nature of its electricity production from having to rely on the weather to produce electricity. This will require the grid to overbuild for when wind and solar are producing almost no electricity and curtail overgeneration for when they produce too much electricity (beyond what can be stored in batteries or exported).
Including this hidden cost, along with the hidden cost of battery storage, is a major reason why our values differ from traditional LCOE estimates published by the Energy Information Administration (EIA) and Lazard, which go more into detail deblow.
What Are LCOEs?
We quote from an earlier piece on LCOEs to explain:
The LCOE is an estimate that reflects the cost of generating electricity from different types of power plants on a per-unit-of-energy basis—generally megawatt hours (MWh)—over an assumed lifetime and quantity of electricity generated by the plant.
In this way, LCOE estimates are like calculating the cost of your car on a per-mile driven basis after accounting for expenses like your initial down payment, loan, insurance payments, fuel costs, and maintenance.
The factors that influence the LCOE for power plants are the capital costs incurred for building the facility, financing costs, fuel costs and fuel efficiency, variable operational and maintenance (O&M) costs, such as water consumption or pollution reduction compounds, and fixed O&M costs, such as routine labor and administrative expenses, the number of years the power plant is expected to be in service, and the capacity factor of the plant, which allows us to divide the costs above by the amount of electricity the facility is expected to generate during its useful lifetime.
As you can see, LCOEs represent the cost of a single unit. Because thermal units don’t suffer from intermittency and can maintain reliability on their own without (dramatically) overbuilding the grid, LCOEs provide decent estimates of the all-in cost of thermal plants. LCOEs are less informative, however, for intermittent resources like wind and solar because these energy sources lack the same value to the grid and require backup power. There are hidden costs that LCOE values simply don’t account for.
For a better comparison, we need to know the system cost of operating a grid with mostly wind and solar that incorporates the hidden costs of intermittency.
What is The All-In Cost of Energy?
We developed our all-in cost of energy values to provide an apples-to-apples cost comparison between thermal generation and operating a grid with wind and solar.
Thermal power plants have the benefit of being able to respond at any moment to changing conditions of the system—specifically ramping up and down to balance demand with generation—which is an essential feature of a cost-effective, reliable grid.
Wind and solar, on the other hand, are not able to respond to changing conditions because they rely on the weather to produce electricity. Because of this, the grid needs some backup source that allows it to respond to changes, either in the form of a dispatchable power plant (natural gas, oil, etc.), battery storage, overbuilding the grid with wind and solar, or a combination of all three. Either way, these are massive hidden costs that typical LCOE values do not take into account, and that is why they’re misleading to the public, policymakers, and grid operators who use them to pursue policies favoring wind and solar.
Our all-in values account for the cost of overbuilding and curtailing, providing backup battery storage, generator/utility returns, capital costs, taxes, and O&M expenses.
As a result of not accounting for the hidden costs of intermittent energy, even the unsubsidized LCOE values estimated by Lazard are extremely low, ranging from $27 to $73 per MWh for onshore wind, $74 to $139 per MWh for offshore wind, and $29 to $92 per MWh for solar.
As we have shown, the true system cost of wind and solar in New England is at least three times the high-end values listed above, and up to twelve times more expensive than the low-end values.
Conclusion
The narrative has been shifting on the true cost of wind and solar for some time. Many people in the industry understand that normal LCOE values are insufficient to judge the full cost of these technologies.
Unfortunately, renewable energy advocates still tout LCOE values as gospel to perpetuate the myth of cheap wind and solar, and there are still plenty of policymakers who buy into it.
It’s time to discard outdated cost metrics for wind and solar, like the LCOE, and embrace the idea that the full, all-in, system cost of wind and solar is prohibitively high to operate a grid with – especially offshore.
Thanks for reading Energy Bad Boys!
LIKE if you think LCOEs are outdated.
SHARE this piece if you want others to think the same.
Powerplant Emergency Fuel Supplies, Past, Present and Future by
which “Is written as a continuation of the discussion started by the Energy Bad Boys in their article “Battery Storage is 141 Times More Expensive Than Liquefied Natural Gas Storage”.


A lot of time spent arguing about the comparative cost of RE vs conventional power would be saved if people just understood that wind and solar cannot work due to the three basic principles of intermittent energy, they ABC as we call it among the Energy Realists of Australia. It can't work, and it should never have been allowed to contaminate and destablise the grids of the western world.
All we have got from trillions of dollars of expenditure is power that is more expensive and less reliable, with massive damage to the planet.
Around the Western world, subsidised and mandated wind and solar power have been displacing conventional power in the electricity supply. Consequently, most of the grids in the west are moving towards a tipping point where the lights will flicker at nights when the wind is low. This is a “frog in the saucepan” effect and it only starts to worry people when it is too late. Too late for Britain and Germany certainly.
https://newcatallaxy.blog/2023/07/11/approaching-the-tipping-point/
Consider the ABC of intermittent energy generation.
A. Input to the grid must continuously match the demand.
B. The continuity of RE is broken on nights with little or no wind.
C. There is no feasible or affordable large-scale storage to bridge the gaps.
Therefore, the green transition is impossible with current storage technology.
The rate of progress towards the tipping point will accelerate as demand is swelled by AI and electrification at large.
In Australia, the transition to unreliable wind and solar power has just hit the wall, while Britain and Germany have passed the tipping point and entered a “red zone,” keeping the lights on precariously with imports and deindustrialization to reduce demand.
The meteorologists never issued wind drought warnings and the irresponsible authorities never checked the wind supply! They even missed the Dunkelflautes that must have been known to mariners and millers for centuries!
https://www.flickerpower.com/images/The_endless_wind_drought_crippling_renewables___The_Spectator_Australia.pdf
There is an urgent need to find out why the meteorologists failed to warn us about wind droughts and why energy planners didn’t check. Imagine embarking on a major irrigation project without forensic investigation of the water supply including historical rainfall figures.
https://quadrant.org.au/news-opinions/climate-change/no-gusts-no-glory/
On the US EIA charts of LCOE, there has always been (or was, haven't checked in several years) a note that LCOE for wind and solar do not reflect true costs because expenses such as long distance transmission and firming are not included.
Lazard has always ignored this note in their reports. In my opinion, what Lazard has done for the last two decades has been blatant lying and misrepresentation to drive the narrative their customers wanted, rather than actually trying to report something resembling reality.
On a different but similar note, I did a little diving in my collection of bookmarks the other day. Explanations of how wind/solar actually do very little to reduce overall CO2 emissions on a reliable grid:
Several (oldish) references on this topic:
"CO2 Emissions Variations in CCGTs Used to Balance Wind in Ireland"
http://euanmearns.com/co2-emissions-variations-in-ccgts-used-to-balance-wind-in-ireland/
"Cost and Quantity of Greenhouse Gas Emissions Avoided by Wind Generation" By Peter Lang
https://bravenewclimate.com/files/2009/08/peter-lang-wind-power.pdf
"Does wind power reduce carbon emissions?" by Barry Brook, references Lang above.
https://bravenewclimate.com/2009/08/08/does-wind-power-reduce-carbon-emissions/
"Why solar and wind won’t make much difference to carbon dioxide emissions"
https://blog.oup.com/2017/10/solar-wind-energy-carbon-dioxide-emissions/
"Wind Integration: Incremental Emissions from Back-Up Generation Cycling (Part V: Calculator Update)" By Kent Hawkins
https://www.masterresource.org/wind-power/wind-integration-incremental-emissions-from-back-up-generation-cycling-part-v-calculator-update/#more-7271
"HOW LESS BECAME MORE… Wind, Power and Unintended Consequences
in the Colorado Energy Market"
https://docs.wind-watch.org/BENTEK-How-Less-Became-More.pdf