


Energy is defined as the ability to do work. As such, the states that harness the most reliable and affordable electricity sources hold the economic future of the country in their hands.
The states that cling to the Green Dream, or whatever they call it, won’t need to remind the last person to turn the lights off when they leave.
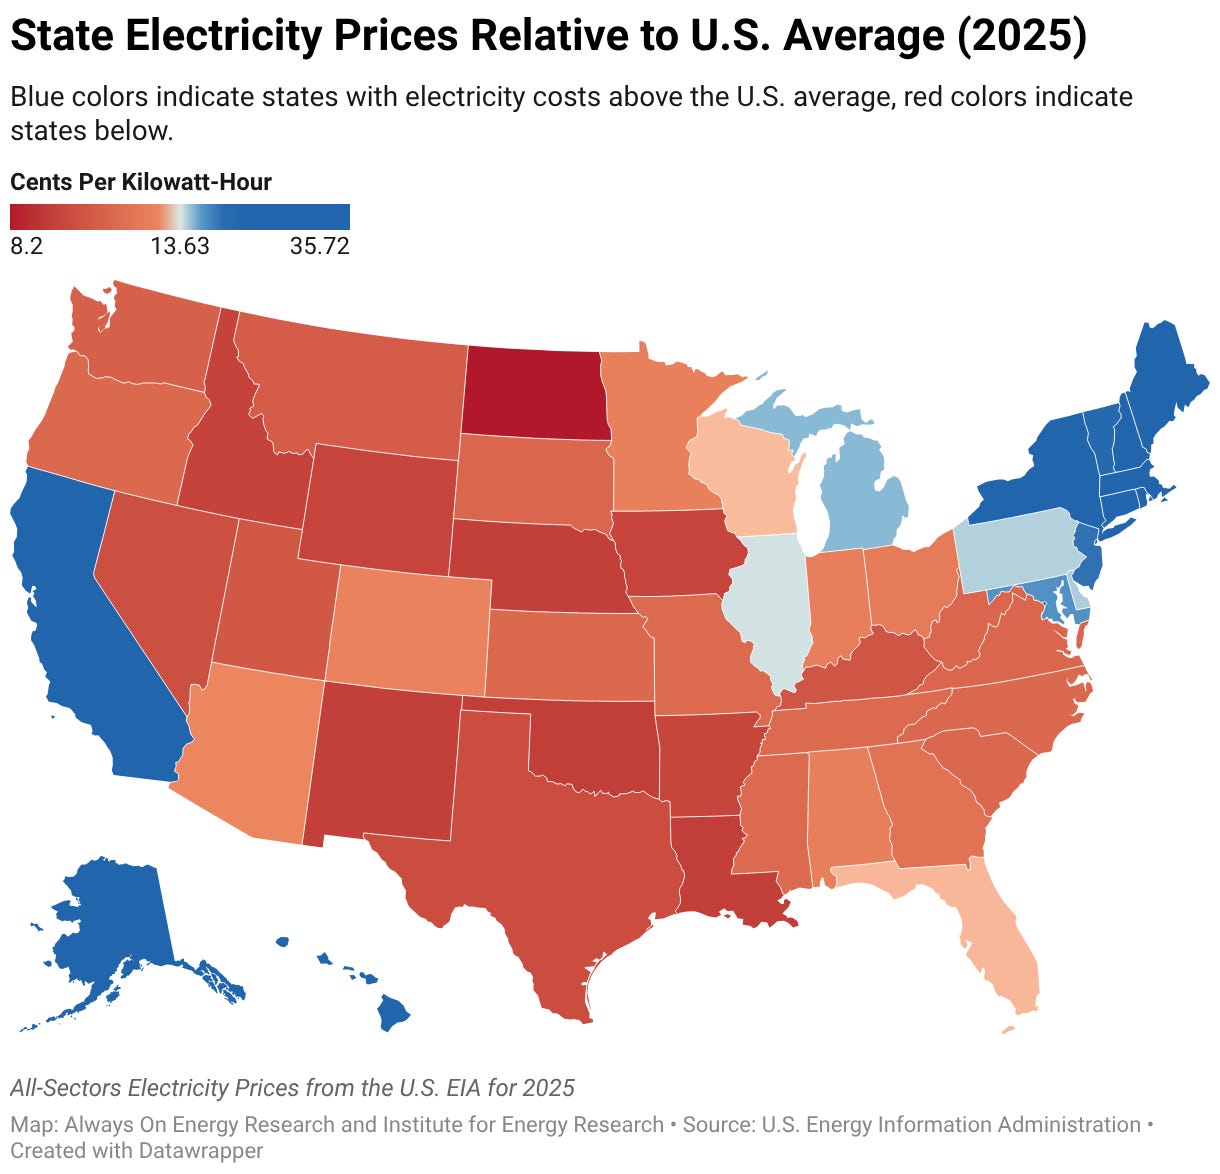
In our Blue States, High Rates report, we identified access to natural gas power plants and pipelines as a major influence on electricity prices. States with abundant gas infrastructure generally have rates below the national average, and states with high electricity prices are generally hostile to new natural gas additions.
Today, we dive back into the Global Energy Monitor (GEM) natural gas power plant data to examine the geographic and ideological fault lines developing around new natural gas construction.
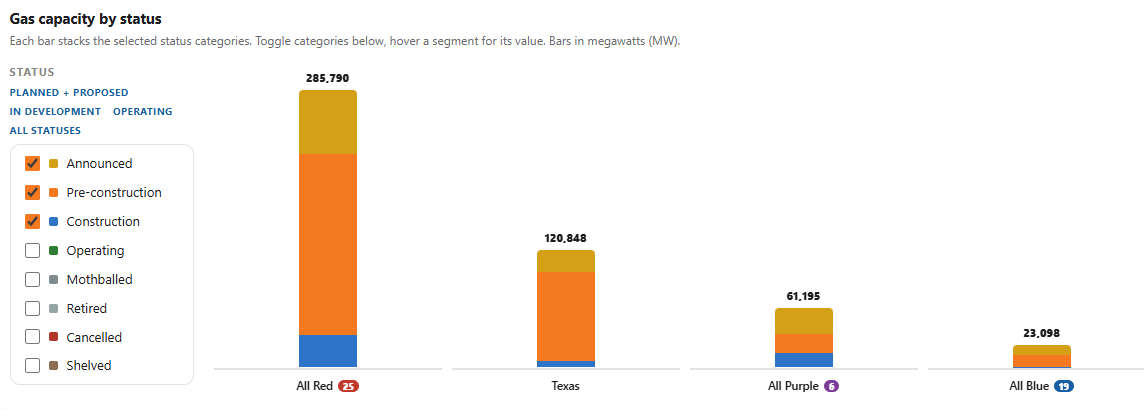
In short, the data shows that 370 to 451 gigawatts (GW) of new gas could be built in the coming decades, the vast majority of which are being constructed and proposed in red states. Red states could potentially build 11.5 times as many natural gas power plants as Blue states, and Texas alone could quadruple the Blue state buildout.

The future of energy is natural gas, and the future of energy is the future of the American economy. Whereas Red states are accepting this reality, Blue states are becoming stuck in the past.
Blue States Missing the Gas Boom
In our Blue States, High Rates report, one criterion we examined was access to natural gas. This is an incredibly important area of energy policy because other dispatchable power sources have been vilified across party lines. This leaves natural gas as the primary fallback dispatchable energy source—and the grid will always need fuel-based resources to meet modern society's energy demands.
However, blue states are becoming increasingly resistant to anything that works at all, including natural gas. Despite the Green New Deal’s failure, this hasn’t stopped many blue states from adopting policies that continue pursuing it, resulting in unfavorable positions toward natural gas.
No surprises here, but the result is that red states and purple states are building far more natural gas than blue states—nearly 12 times more.
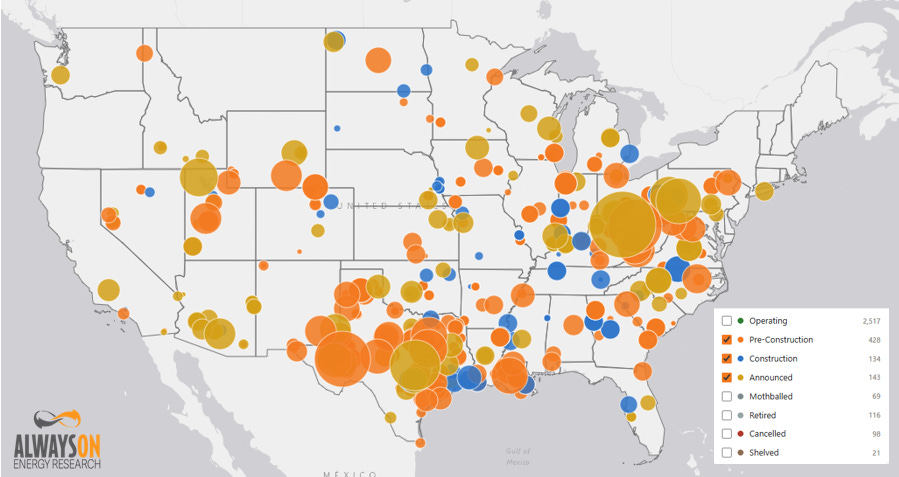
The map below of natural gas plants that are under construction, in pre-construction, and announced shows a stunning divide along ideological lines.
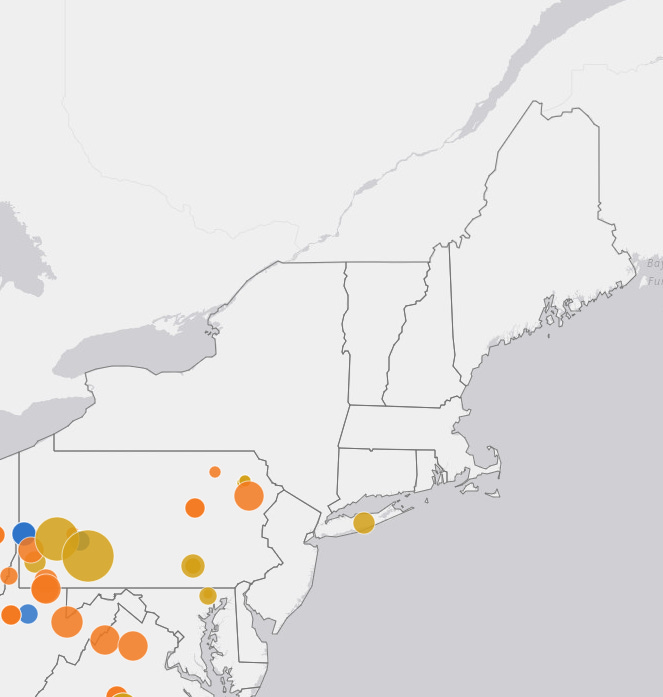
As you can see, despite a projected increase of 451 GW for the national gas fleet overall, several “blue states” have zero planned new gas capacity—including the usual suspects of Oregon, Delaware, New Jersey, and the entire New England region, which is noticeably bare.
This is a zoom-in on the Northeast region to emphasize just how stark the divide is.
Meanwhile, California, New York, and Washington actually have some new gas capacity planned and under construction, but it’s small in the grand scheme of national gas growth.
It’s also worth noting that five of the six Blue states with electricity rates below the national average, as highlighted in our Blue States, High Rates report (Colorado, Minnesota, New Mexico, Oregon, Virginia, and Washington), all have new planned natural gas plants.
This is why we felt natural gas access was an important criterion for our analysis. The most extreme blue state policies often include an aversion to building new fuel-based resources, and it’s no wonder that these states are often the most expensive as a result.
In contrast, Red States are building 12 times more natural gas capacity than all of the blue states combined, with Texas alone outpacing the combined future natural gas capacity of all blue states by a 4:1 ratio.
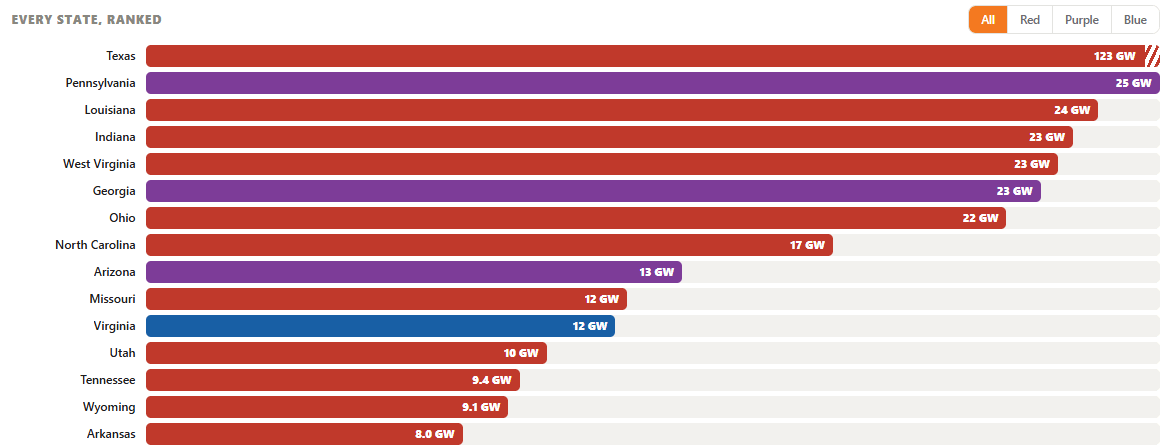
The dashboard allows you to find out how natural gas each state is constructing and planning. Below, we show you the top 15 states. Notice that only one blue state (Virginia) makes the cut, while no blue states are in the top 10.
Blue State Border Buildouts
Another interesting trend is that there are large buildouts of natural gas on the border of multiple blue states that are building no or very few natural gas facilities themselves.
For the clearest example, let’s look at Illinois.
While Illinois itself is building two natural gas facilities that total just over 1 GW of power, 8.2 GW are being constructed or planned directly on or very near the border in Indiana. Furthermore, another 3.9 GW of natural gas capacity is planned on the border in Missouri and Iowa.
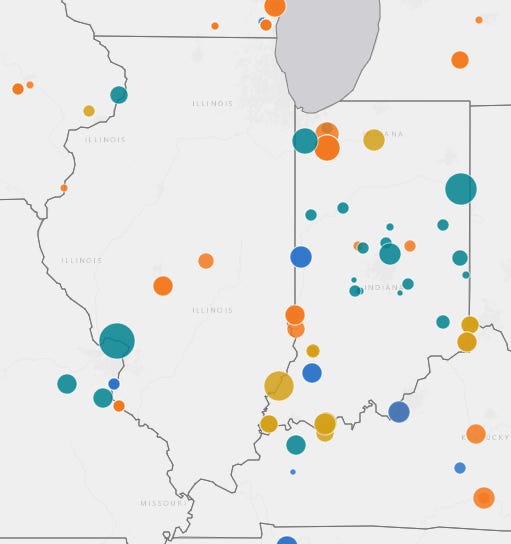
Similar trends are occurring for Colorado, New Mexico, California, and Washington, only to a lesser extent.
This could be highlighting a reality that while Blue states still need the reliable capacity that natural gas offers, they are refusing to build the amount they need within their borders. Blue states may very well become increasingly reliant on natural gas imports from neighboring Red states to maintain reliability.
Data Center Dedicated Gas Plants Run Red
According to our Dashboard, there are six natural gas power plant projects for dedicated data center use in Blue states. These six projects have a combined capacity of 6.25 GW, accounting for just 3.5 percent of the 181 GW of data center dedicated gas plants expected to be built in the next two decades.
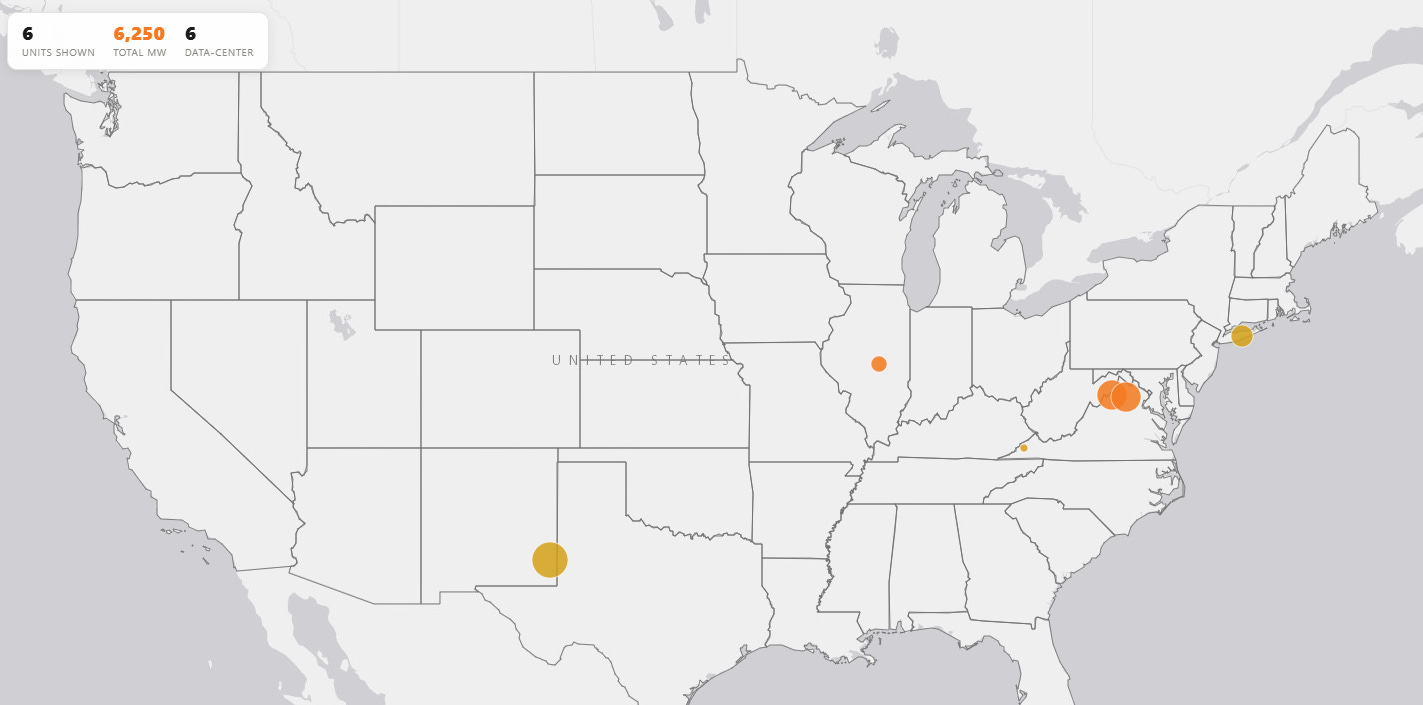
The vast majority of natural gas facilities dedicated to data centers are being constructed or planned in red states. As the dashboard shows, Red states are building 203 facilities, totaling over 151 GW of capacity.
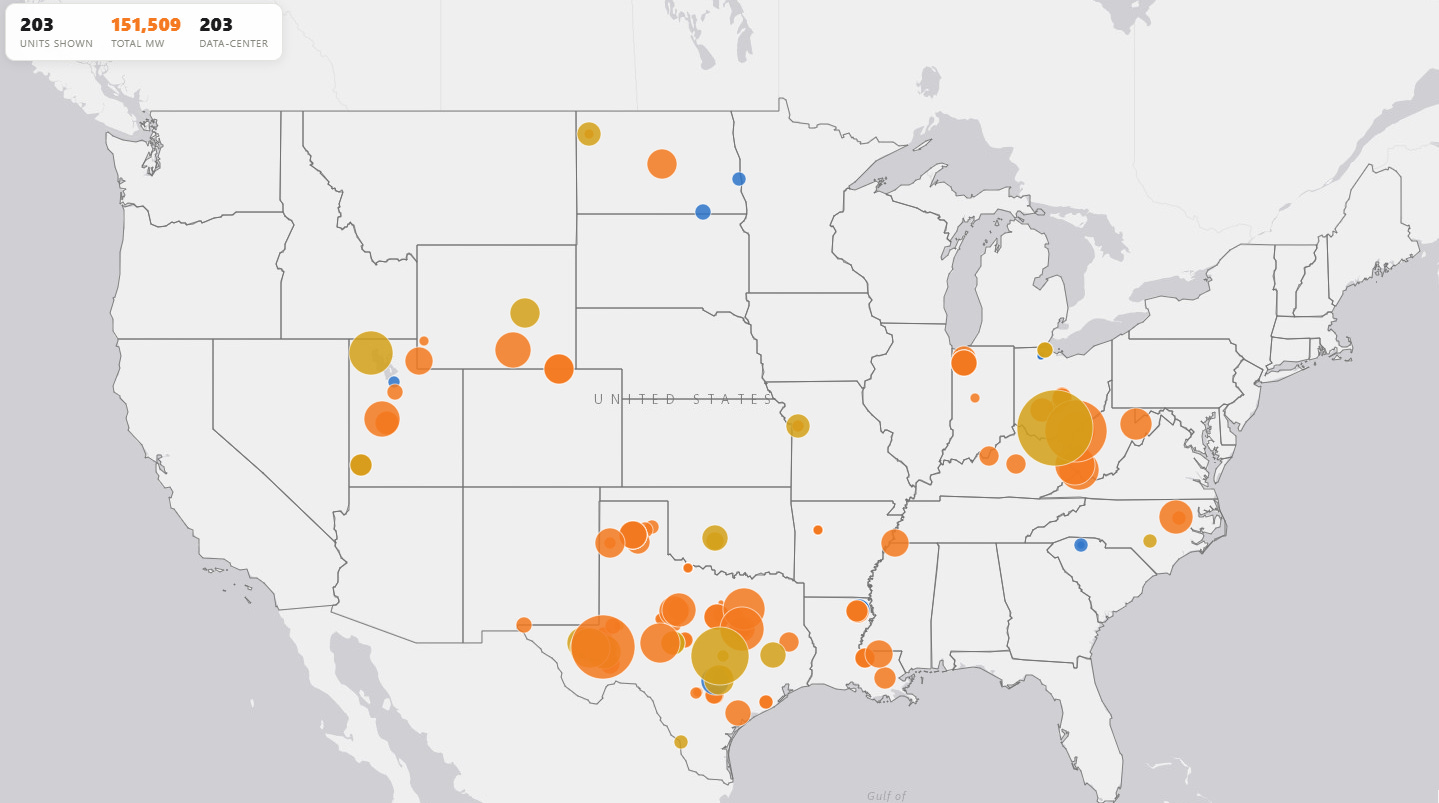
Even Purple states, which are a minority group within the country, show 40 projects totaling 23.5 GW.
Net Thermal Trends
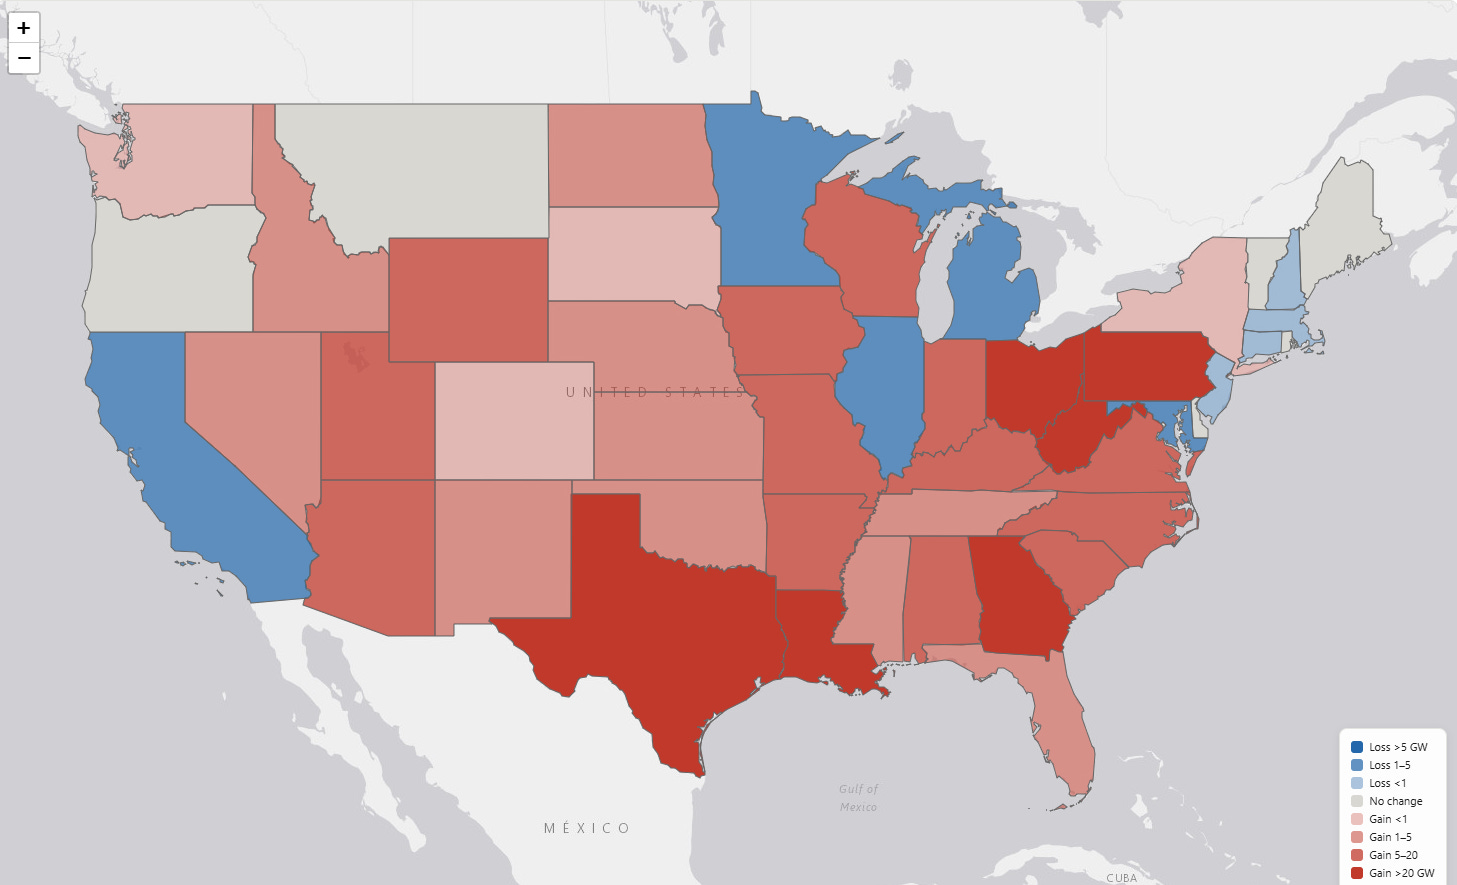
We also wanted to see what the trends were for net thermal capacity among the states to see which ones are keeping up with thermal retirements.
This analysis uses GEM projections and EIA 860 coal, natural gas, and nuclear retirement announcements to estimate what the net thermal capacity trends will be in each state over the next two decades.
We found zero Red states that were projected to have a net decline in thermal capacity (including IRP gas additions), while eight blue states and one purple state were projected to have a net loss of thermal capacity.
Red and Blue states also differ on the natural gas technologies they are constructing. Blue states, for example, are building CT plants, while Red States are building whatever they can get their hands on.
This is because blue states are building gas to balance wind and solar resources, and red states are building to power the future.
Conclusion
As we explained in last week’s post, data from GEM shows that the energy source of the future is clearly natural gas. The reason is fairly clear—nuclear and especially coal are not looked upon as favorably, and modern society still needs reliable, affordable electricity to power the grid.
While we don’t think this is the best strategy for several reasons—mainly because of the loss of fuel diversity/storage that nuclear and coal provide and an overreliance on a resource that competes with home heating—it’s certainly better than what blue states are pursuing.
When looking at the GEM data, there is a clear difference between Red and Blue states on this issue.
We are increasingly heading into a future where Red states are powering the needs of the future, while Blue states fiddle their thumbs contemplating how to make insufficient resources work for the grid—or, more likely, how to make energy users work to accommodate them.
As a NJ resident, this does not make me feel any better.
Several comments
1. A followup with where gas transmission pipelines are being built would round this piece out.
2. Mr, Global has been pretty outspoken on all this new demand driving up the cost of natural gas, thoughts?
3. If natural gas prices start to rise, do you see a return to coal?