Lazard's Low-End LCOE Estimates for Solar Are Still Too Optimistic
Even in the Southwest, solar is more expensive than existing coal, natural gas, and nuclear power plants
One of the biggest values we seek to provide our readers at Energy Bad Boys is calling balls and strikes in the energy space.
Last week, we detailed why we think Lazard’s Levelized Cost of Energy (LCOE) estimates for wind were unrealistically low and the product of feeding low-quality inputs into their cost calculations to get the answers they wanted.
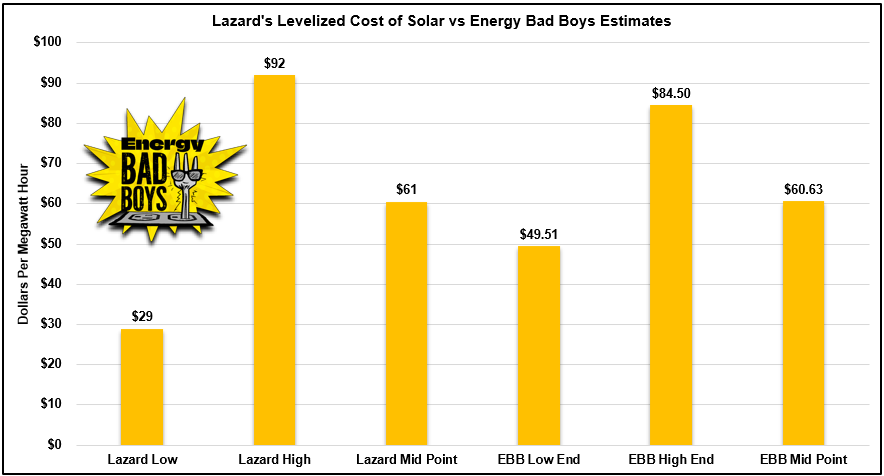
Today, we will do a similar analysis for solar, and while we don’t agree with all the assumptions Lazard used, we found the cost ranges they produced were not as bad as wind. However, Lazard’s low-end estimate - the one most frequently used by wind and solar advocates to claim solar is lower cost than thermal resources - is still far too generous.
Our analysis shows that the true low-end LCOE estimate for solar is 70 percent higher than what Lazard suggests, and this higher low-end cost for solar means solar is still more expensive than existing thermal resources, even in the American Southwest and without accounting for the system costs not included in LCOE estimates.
First, Some Housekeeping
The All-In LCOE: Last week, our readers provided extensive feedback, correctly pointing out that we cannot examine the cost of wind and solar in a vacuum - which is what typical LCOE values estimate - and that to understand the full cost of incorporating intermittent resources onto the grid, we need to evaluate the entire system. We agree. In fact, we’ve pretty much pioneered calculating the “All-In LCOE” over the last several years and have written extensively on the topic. If you want our take on that, please read How to Destroy the Myth of Cheap Wind and Solar. Our analysis of Lazard LCOE estimates in these posts centers on assessing whether their assumptions even make sense.
What is the LCOE, and How is it Calculated? For a primer on what the LCOE is and how it’s calculated, read last week’s piece: Cooking the Books 2: Lazard's Levelized Cost of Energy Estimates for Wind.
Energy Bad Boys in the Congressional Record
Before we dive into Lazard’s solar estimates, we wanted to share that the Energy Bad Boys were recently entered into the Congressional record. Many thanks to Representative Harriet Hageman (R-WY) for entering Hawaii Five Uh-Oh into the record.
Calculating the Cost of Solar
As we discussed last week, the LCOE of an energy source is primarily influenced by the assumed capital cost of the plant, the capacity factor, and the number of years a plant is in service.
The table below shows Lazard’s assumptions for these inputs and compares them to what we believe are more realistic ones. Overall, we think Lazard’s low-end assumptions are far too optimistic, their high-end estimates may be too pessimistic, and their midpoint is about right, even though we arrive at similar estimates using different assumptions.
Capital Costs
Lazard uses a capital cost range of $850 per kilowatt (kW) of installed capacity to $1,400/kW. The Electricity Market Module produced by the U.S. Energy Information Administration (EIA) uses a range of $1,393 to $1,758 per kW, with a capacity weighted average of $1,448/kW. Our most recent conversations with people in the utility industry have ballparked the cost at around $1,250/kW.
We used $1,250 for our low and mid-point estimates and EIA’s capacity-weighted average for our high-end estimate, which is rather conservative given the higher estimates in different regions around the country.
Useful Life
Useful life is the biggest point of disagreement between what we see and what Lazard is projecting.
Lazard expects solar facilities to operate for 35 years, but the Solar Energy Industries Association (SEIA) states the lifespan of a solar photovoltaic panel is approximately 20-30 years, while the lifetime of an inverter can be upwards of 10 years.
Interestingly, Lazard assumes a longer lifespan for solar plants than natural gas facilities, which Lazard assumes a lifespan of 20 years.
We used 25 years as a solid mid-point estimate. In the future, it will be interesting to see if this remains realistic and if solar facilities start being “repowered” after 10 years, like wind turbines, as utility resource planners begin to assume that solar facilities will elect the Production Tax Credit instead of the Investment Tax Credit.
Capacity Factors
It is trickier to arrive at a single cost estimate for solar because, unlike wind turbines, which are generally built in the central portion of the country where wind speeds are highest, solar panels are installed all over the country.
The map below from the U.S. Energy Information Administration shows solar facilities in a pinkish color, with larger facilities shown in a purple hue.
This wider geographic dispersion leads to a more significant range of costs based on the solar resources of the area in question.
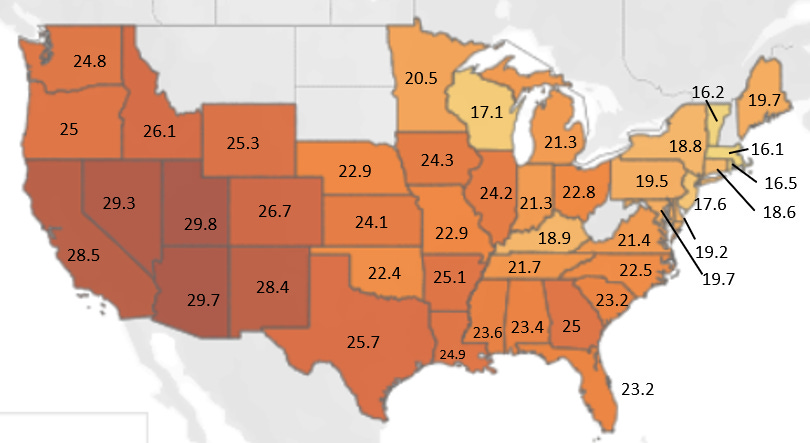
The map below uses data from Lawrence Berkeley National Labs (LBNL) to show state-wide solar capacity factors by state. Several individual projects in the Southwest exceed 30 percent, while some (but few) reach Lazard’s high-end assumption of 35 percent. Additionally, no state had a state-wide capacity factor as low as Lazard’s low-end assessment of 15 percent.
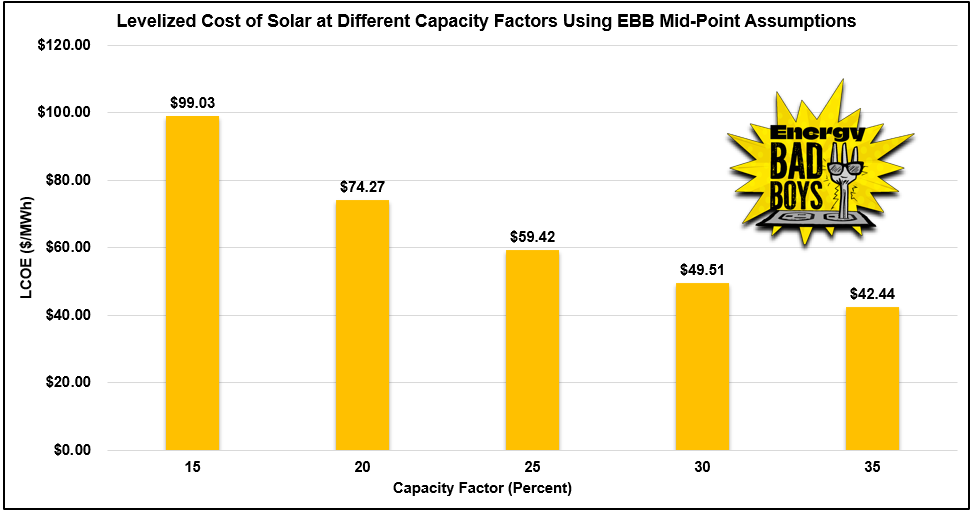
For our assumptions, we used 30 percent as a high-end value, 24.5 percent as a mid-point value because it is the U.S. average capacity factor, and 20 percent to represent the low-end range.
Because solar capacity factors are low—below 30 percent— even a few percentage points can make a big difference to the LCOE. The graph below shows the LCOE of solar using our mid-point assumptions but with a range of capacity factors.
Implications
Lazard’s underestimation of the low-end cost of solar has important implications for resource planning.
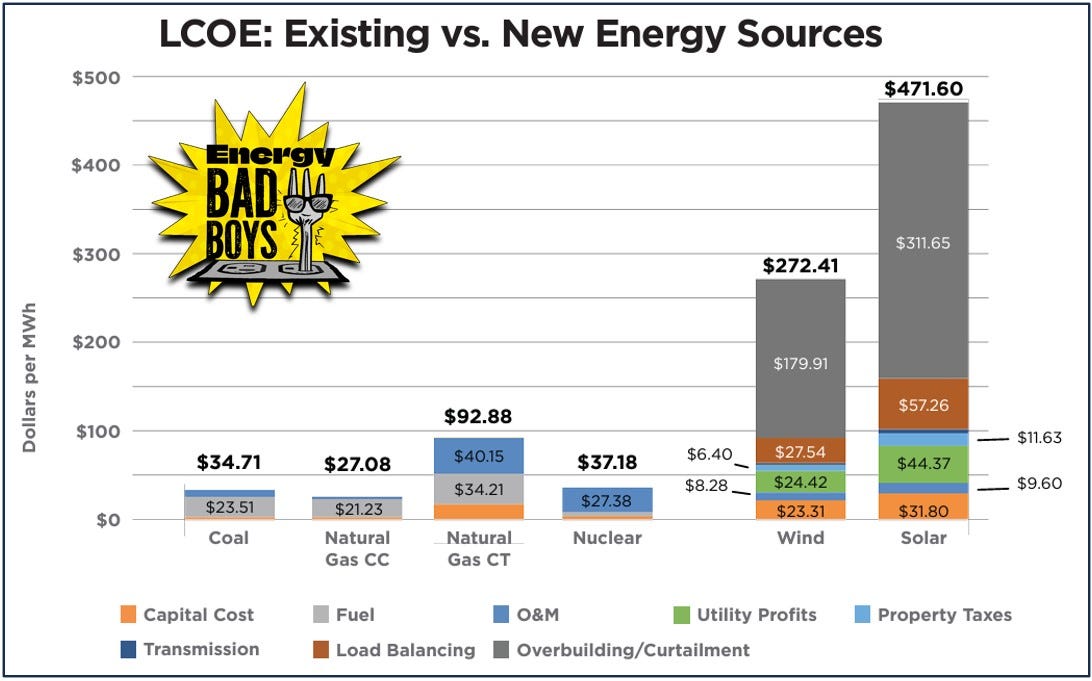
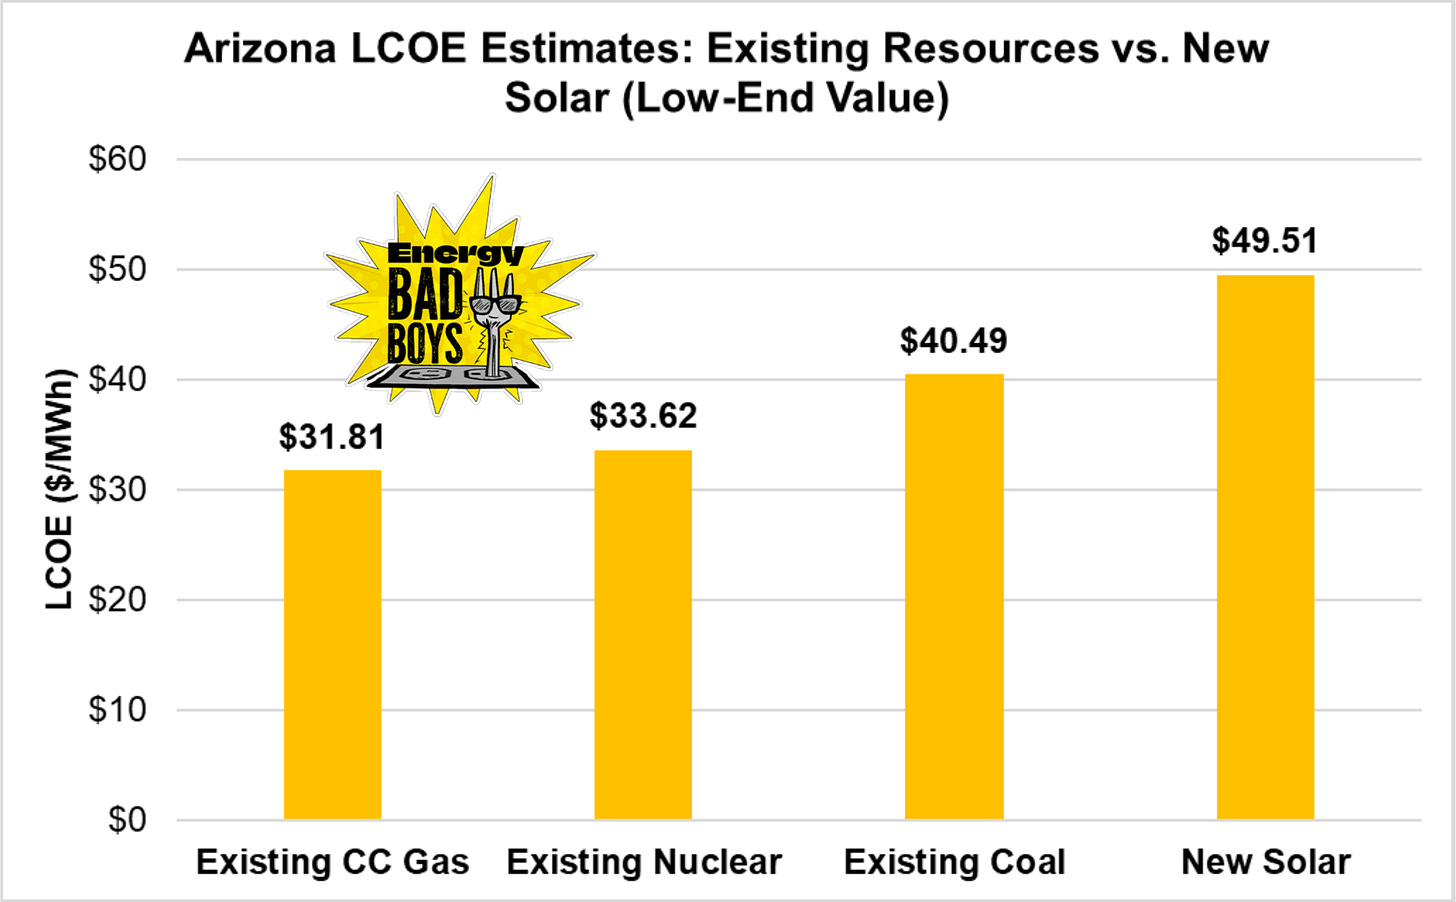
For example, Arizona and Utah have good solar resources relative to the rest of the country, but a low-end cost estimate of $49.51 per MWh for solar means the unsubsidized cost of these resources is still higher than the cost per MWh for existing power plants on the system, as you can see from the graph below.
Unfortunately, based on overly generous assumptions for the cost of solar in the US, Lazard estimates are used around the country in resource planning procedures to advocate for the closure of thermal generators and their replacement with solar panels and to convince legislators that the so-called energy transition will be economical, which is not true.
When you combine the impact of NREL cost projections and Lazard LCOE estimates, the case for the energy transition is being settled based on highly optimistic and, in some cases, unrealistic assumptions for the cost of wind and solar. These estimates are better applied to understand the wishful thinking of wind and solar advocates than to grasp the realistic cost expectations for the energy transition.
Conclusion
While not as bad as its wind estimates, Lazard’s solar costs still mislead people into thinking solar energy is less expensive than it is. We find it important to conduct analyses like this because we believe the industry as a whole, but especially those who regulate and legislate energy policy, need to be more critical of reports like Lazard's before accepting it at face value to implement energy policy.
Moving forward, any discussion of the cost of the energy transition to wind and solar needs to be more robust than depending on reports like Lazard's, which notes specifically that it “does not consider the intermittent nature of selected renewables energy technologies or the related grid impacts of incremental renewable energy deployment,” which is the most important thing to consider in the conversation.
Climate Science is About to Make a Huge Mistake by





Useful life - older solar farms in CA are replacing panels after 10-12 years. They still work, but they degrade and produce less. The solar farm cannot meet its power purchase agreement minimums and must replace the degrading panels. They can’t just add more because it violates the terms of their interconnection. The “old” ones are scrapped, of course.
Capacity factor - high time someone looked at capacity factor on a more granular level. State by state is interesting. I get a good laugh out of NY thinking they can rely on solar. Too far north and it snows. It is the minimums that count.
A couple thoughts. LCOE is extremely misleading and should be phased out of the discussion - as EBB has pointed out it's the total system cost. Second, solar is highly geography dependent for a number of reasons (among them amount of sunshine, environmental impact), so overall costs need to take this into account and will differ significantly across the country. I'm sensitive to this because I live in CT where solar farms are consuming forests and farmland.