Cooking the Books: How Studies Favorable to Wind and Solar Are Propped Up On Unrealistic Cost Assumptions
Garbage In: “Cheap” Wind and Solar Out
In God we Trust. All others bring data -W.E. Deming
For years, we’ve been told that wind and solar will experience declining costs forever, ensuring these energy sources will inevitably be lower cost than even existing conventional coal, natural gas, and nuclear generators. This narrative has been at the forefront of public policy, influencing decisions at the state, federal, and local levels.
Unfortunately, this narrative is also wrong, meaning the policies based on these assumptions have been more costly than advertised.
Today, we dig into the genesis of many of these bad assumptions, the Annual Technology Baseline (ATB) produced by the National Renewable Energy Laboratory (NREL), and explain how these estimates have chronically underestimated the true cost of building wind turbines and solar panels.
As a result, they have also underestimated the cost of generating electricity from them, leaving families and businesses to suffer the consequences of higher prices.
Garbage In, Garbage Out
Before we dig into the details of the NREL’s ATB, we need to take a 10,000-foot view of how energy models work. As energy modelers, we at Energy Bad Boys understand that a model is only as good as the assumptions it’s built around. Models aren’t prophets. They merely tell the story of their inputs. Bad inputs will yield bad outputs.
This is why we strive to use the most realistic assumptions possible in our modeling, heavily weighing them toward historical and current performance with a healthy dose of skepticism about future projections. After all, predictions are hard, especially when they are about the future.
Unfortunately, this view is not widely shared by other modelers in the industry.
As a result, there have been decades of reports written using the overly optimistic capital cost assumptions in NREL’s ATB. These reports have been used to justify renewable energy proposals in states across the country.
The NREL ATB
The NREL ATB report is a popular source—perhaps the most popular source—for technology costs among energy modelers and industry professionals nationwide.
Per NREL’s website: “The NREL Annual Technology Baseline (ATB) provides a consistent set of technology cost and performance data for energy analysis.” Base year costs for ATB reports are estimated using a “bottom-up” approach of piecing together real-world component cost data. These base years are then projected into the future “based on trend lines between historical data and long-term (2030 or 2035, and 2050) estimated costs.”
When asked why they used NREL’s ATB for their capital cost assumptions, one resource planner at a utility we spoke to said, “Their guess is as good as anyone else’s.”
As a result, NREL cost estimates are routinely used by electric utility companies and interveners in resource planning decisions around the country, including Xcel Energy and Otter Tail Power Company in Minnesota and Colorado, Tucson Electric Power in Arizona, and many others.
Because of how widely adopted NREL’s cost assumptions are in the industry, it is incredibly important to understand if they reflect what we see in the real world.
After a closer look, EBB found that NREL has consistently underestimated the cost of wind and solar, as it has projected dramatic cost declines for both technologies that far exceed reality. As a result, decades of resource planning decisions have been based on inaccurate assumptions.
Flawed Cost Projections and the Negative Impact
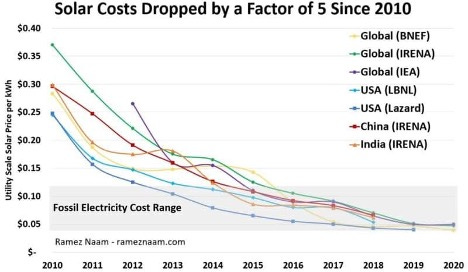
For a while, projected cost declines for wind and solar were actualized in real life, as you can see in the graph below.
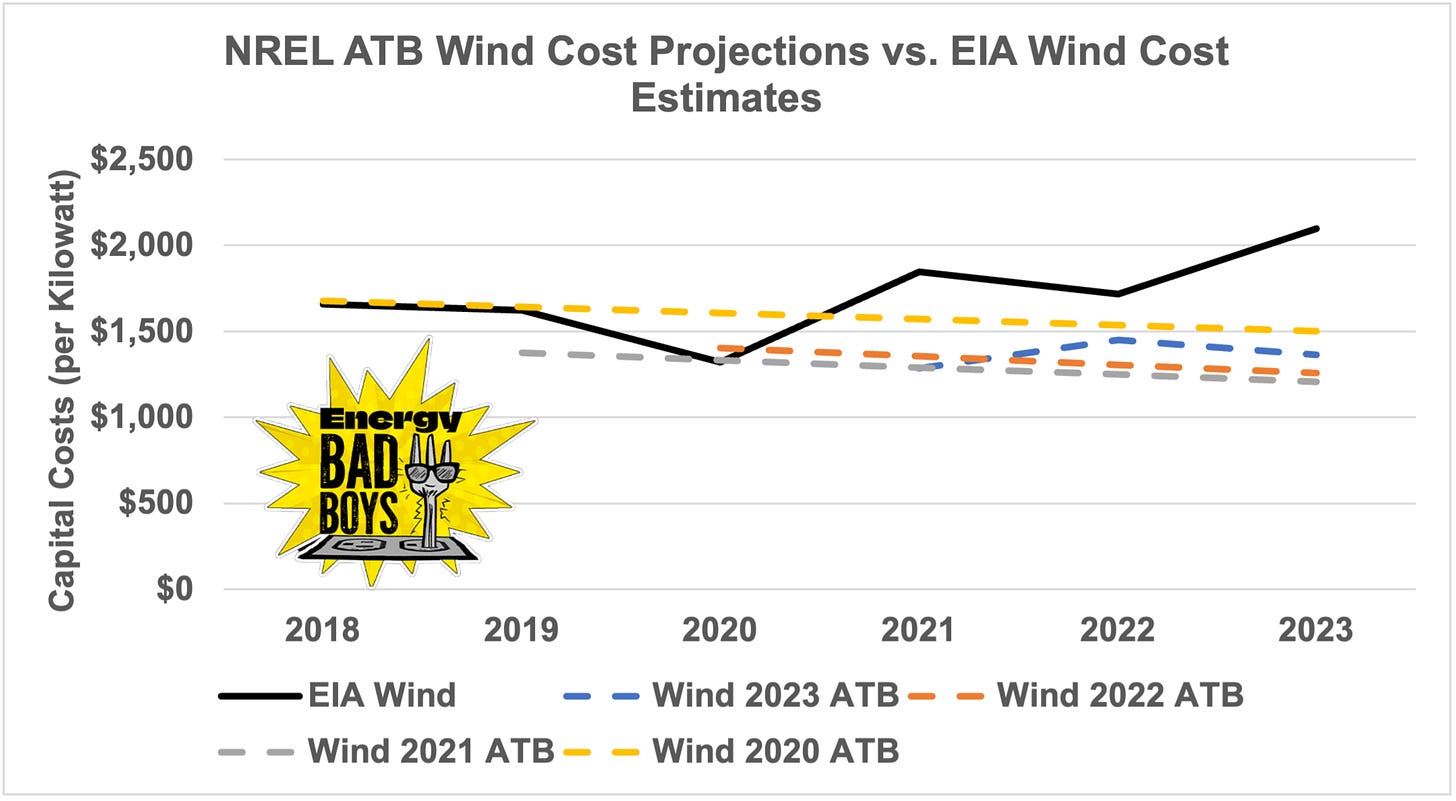
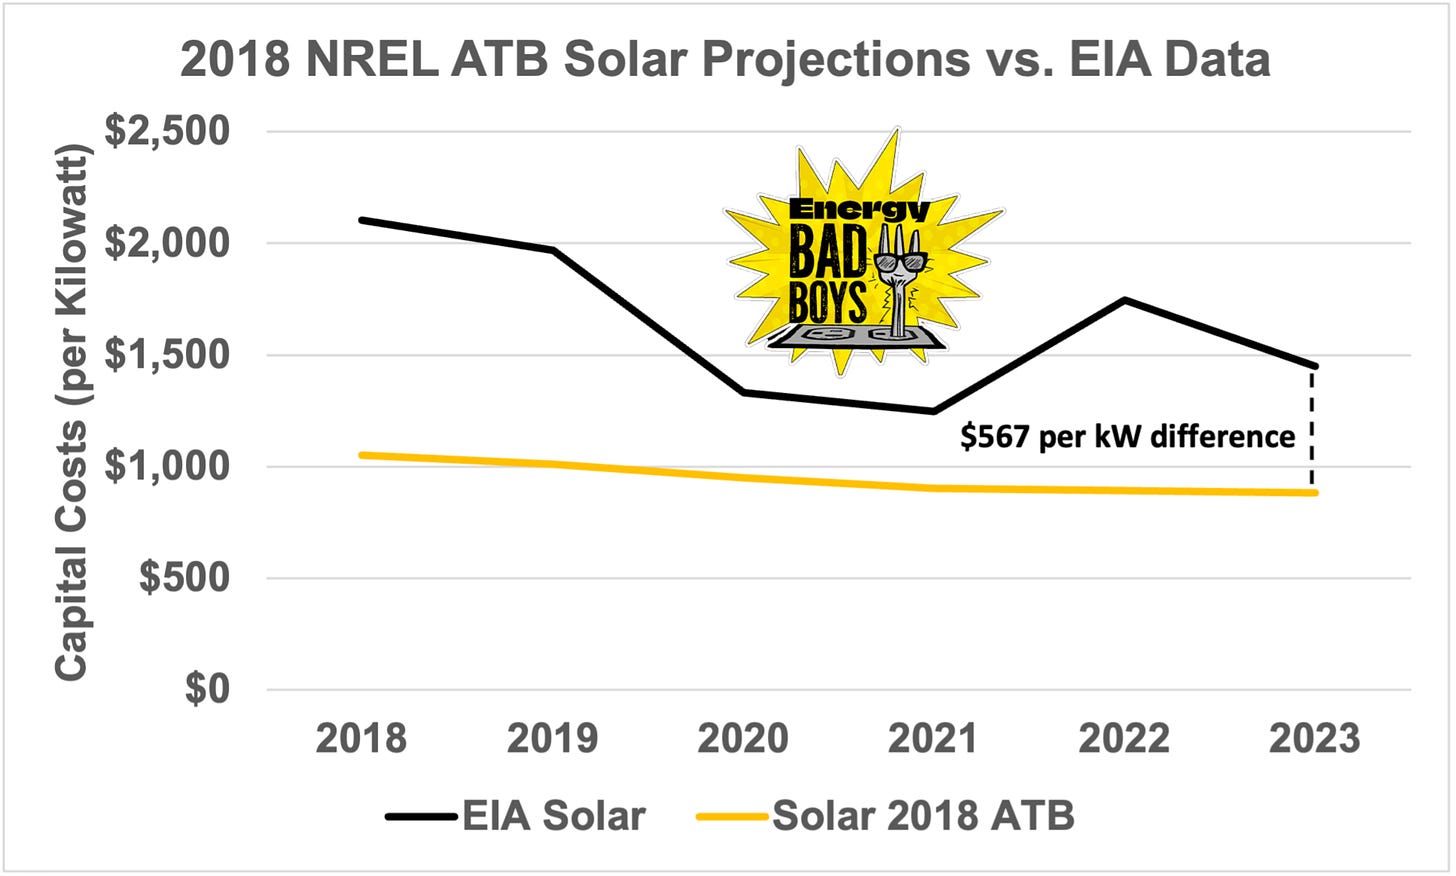
In recent years, however, the capital cost of wind and solar have remained steady or increased, yet cost projections from NREL have continued the dramatic cost decrease from prior years. The graphs below show how NREL has overestimated wind and solar capital cost declines in every ATB report since 2018.
While NREL predicted a steady cost decline for wind turbines in its ATB, actual prices have been going up, instead. This resulted in capital cost values for wind in 2023, published by the Energy Information Administration (EIA), being 54 percent higher than the NREL 2023 ATB cost assumptions for wind.
NREL has fared better for solar in its more recent ATB by reeling in its expected cost declines to better reflect the realities on the ground. However, in 2023 ATB still underestimated EIA’s capital cost estimates by over $100.
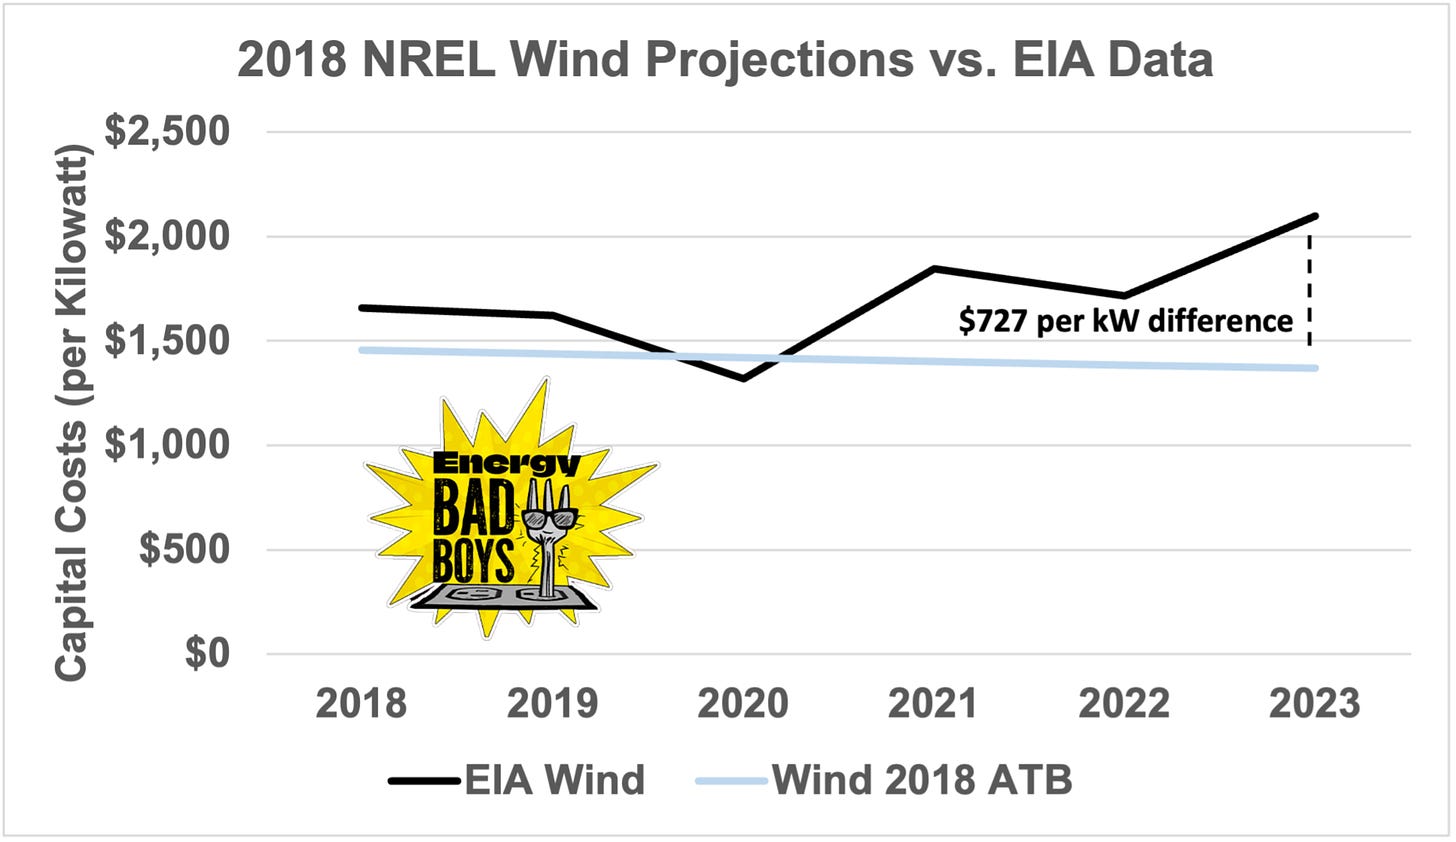
When focusing on earlier versions of NREL’s ATB, which have been used as inputs in reports claiming wind and solar are economic replacements for thermal generators for years, cost differences are even larger.
Comparing the 2018 NREL ATB capital cost estimates to the costs published by EIA, EIA costs are 53 percent larger than NREL for wind and 64 percent for solar by 2023, as you can see in the graphs below.
This has real-world consequences when it comes to the Levelized Cost of Energy (LCOE) estimates for wind and solar.
As you can see below, using real-world 2023 capital costs from EIA, the LCOE of wind is $67 per megawatt-hour (MWh), compared to $47 per MWh using capital cost projections for 2023 in NREL’s 2018 ATB This a difference of $20 per MWh, or 30 percent of the total real cost.
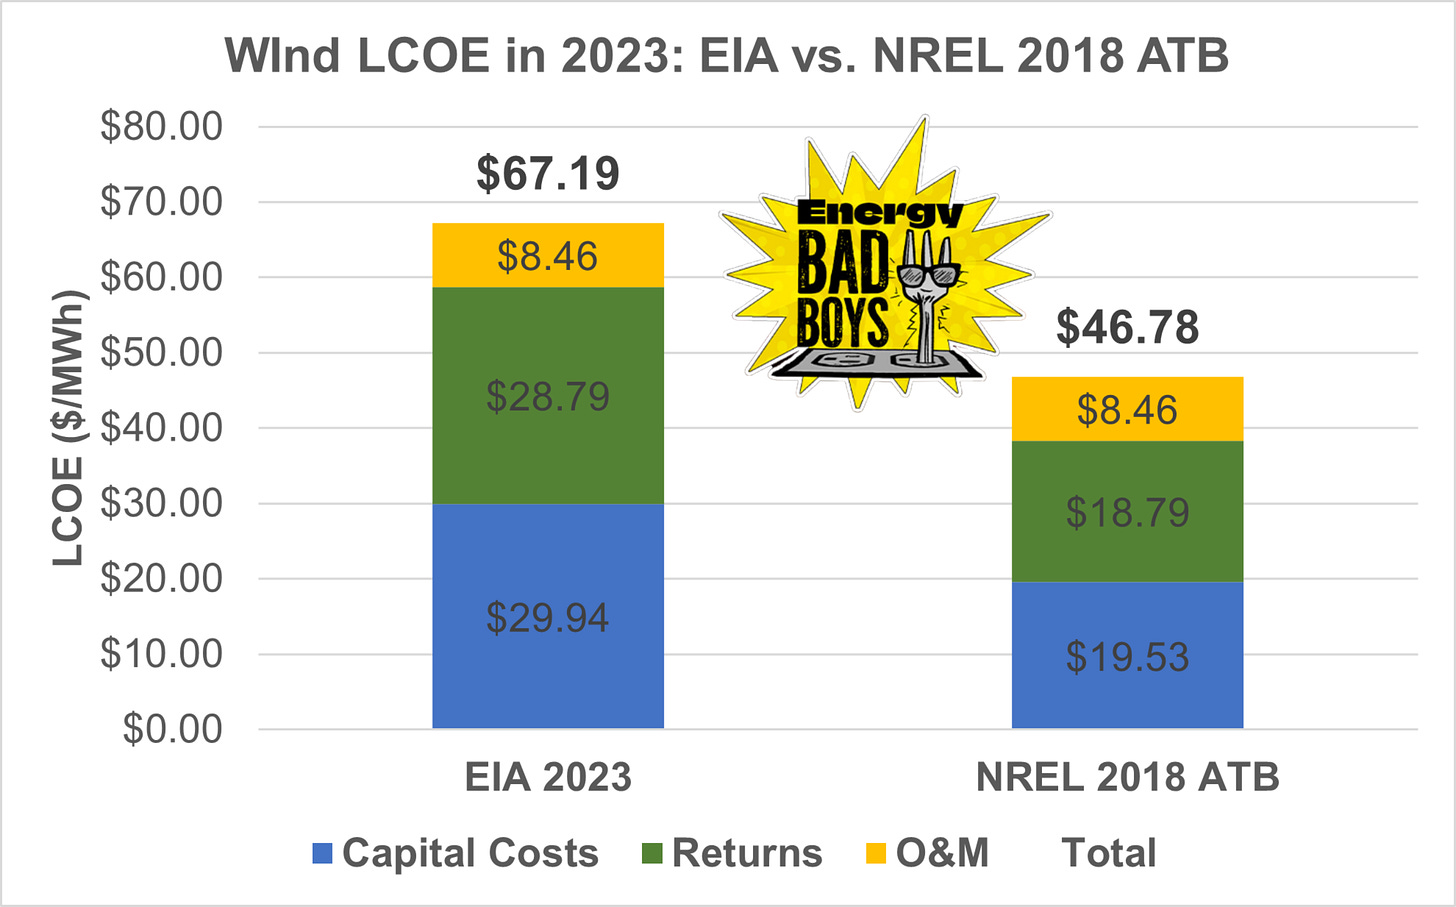
Solar was even worse, as the differences in capital cost showed a $23 per MWh gap between EIA costs and NREL projections.

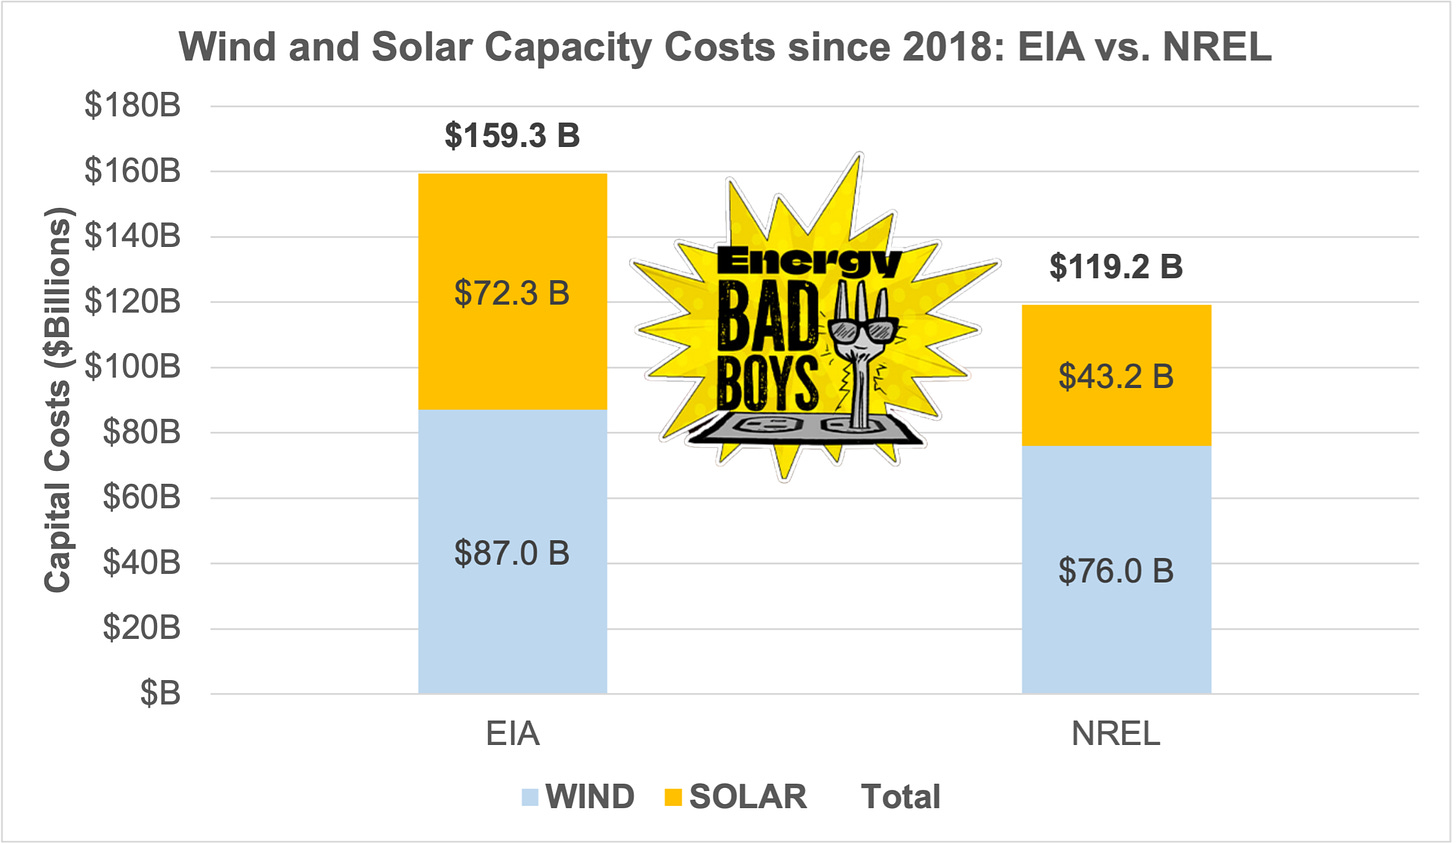
When we consider that 100 megawatts (MWs) of new wind and solar capacity were built from 2018 to 2022, the differences in capital cost estimates vs. reality result in billions of dollars in additional expenses.
If these wind and solar facilities had only cost as much as NREL estimated in 2018, they would have cost $119 billion. Instead, they cost ratepayers $159 billion, a difference of $40 billion.
Conclusion
By using the NREL ATB, utility planners and wind and solar special interest groups have chronically underestimated the cost of using wind and solar energy, which is then foisted upon the electricity customers who buy power from these facilities.
While NREL’s annual projections have gotten closer to the mark in recent years, they are still off by a fairly large percentage.
These projections still have an influence on utility companies and other groups, who use NREL cost projections as gospel to argue that wind and solar are now the cheapest energy sources and that the grid can transition to renewable energy sources cost-effectively.
Sadly, in many cases, the damage has already been done but by identifying the shortcomings of the ATB in projecting capital costs for wind and solar in the past, we hope that we can better temper the influence of these estimates in the future.
Thank you for reading Energy Bad Boys.
Like and share this post.
Don’t forget to hit subscribe!
New IRS Guidance Makes the Inflation Reduction Act’s Energy Subsidies Harder to Eliminate by
Shanghaied by
FERC transmission order "gift" to solar and wind by
Environmentalism In America Is Dead by




These efforts to cost wind and solar production by themselves miss the point - it is the SYSTEM cost that matter. Wind and solar cannot provide continuous input due to nights with little or no wind and there is no feasible or affordable storage in sight to cover the gaps.
So we have to keep conventional capacity available to provide dispatchable energy to fill the gaps and the cost of that firming or backup has to be taken into account because we are stuck with hybrid power systems.
The capital cost and LCOE cost comparison between wind and solar vs. fossil fuels is like comparing apples and bananas. It may cost $1,500/Kw to build a wind or solar project but that Kw of nameplate capacity only produces 300 watts and 200 watts of output on average respectively. You would have to spend $5,000/Kw for wind and $7,500/Kw for solar to get the same total average output as an equivalent base load gas, coal or nuke plant. And, as they say on the late night infomercials "But wait, there's more!", the land usage would be obscene for wind (1.3 square meters per watt) and solar (0.3 square meters per watt) versus combined cycle gas (0.002 square meters per watt) and nuclear (0.0002 square meters per watt). Also the wind and solar would have to be entirely backed up by batteries or fossil fuels due to periods of no wind or no sunshine. Try running the 4.6 million square foot Meta Platforms data center in Prineville Oregon (the largest in the US) on wind or solar (pro tip: take a look at NREL's maps on average wind speeds and solar irradiance and Prineville OR isn't exactly a great place to put wind mills or solar panels).